Technical indicators are very crucial in technical analysis. They provide insights to the traders that are not immediately visible through action alone.
Understanding these signals can help you stay ahead in your trading journey, and you can understand the market movements rather than just going with the flow of the market.
Key Takeaways
- Technical indicators are analytical instruments that traders use to assess market trends, price fluctuations, and possible trading scenarios by interpreting past price history and chart patterns.
- Technical indicators can provide an unbiased view of the market by presenting information based on mathematical formulas and visual representation. In other words, technical indicators remove the emotions that can dictate trading decisions.
- Trend indicators, momentum indicators, volume indicators, and volatility indicators are four main types of indicators, and they provide different perspectives of the market.
- Well-known indicators include moving average, RSI, Bollinger Bands, and MACD.
- Using two or more indicators (e.g., RSI and MACD) will improve your chances of accurate trading signals and discount unreliable false signals.
- Keep in mind that indicators are calculated based on past data, and therefore, you should always backtest before putting any of the indicators into action in real trading.
- Backtesting will increase your chances of not making harmful mistakes or losses, and it will help to improve your trading strategies.
- Moving Average Crossover and RSI Divergence are examples of straightforward but effective/reliable strategies.
- No one tool is perfect; technical indicators should always be taken in combination as a part of technical analysis.
What are technical indicators?
Technical indicators are tools used by traders to understand stock price movements by looking at charts. They help in understanding whether a stock might go up or down in the future.
These indicators are important for traders who want to understand the market trends without being distracted by the disturbances of the market. When traders use technical indicators, they start being more disciplined, and they develop a good trading strategy. This helps them have a better trading mindset, and they become more logical and consistent in trading.
Types of Technical Indicators
There are several types of technical indicators, each serving a different purpose. Here are some of the most commonly used:
- Trend Indicators: The trend indicators show the direction in which the market is moving. For example, moving averages and the MACD (moving average convergence divergence)
- Momentum Indicators: Momentum indicators measure the speed of price movements. For example, the RSI (Relative Strength Index) and Stochastic Oscillator.
- Volume Indicators: These analyse the volume of trades to confirm trends. For example, the on-balance volume (OBV) and volume oscillator.
- Volatility Indicators: Volatility indicators measure the rate of price changes. For example, include Bollinger Bands and the Average True Range (ATR).
How Do Technical Indicators Work?
Let’s take an example using cricket. Suppose you are the coach and you are seeing Virat Kohli in action. You look up his number of runs during the recent matches to find out whether he is in good form.
You also get to know whether he is playing too fast and could get out shortly. Then you compare his rate at which he is scoring against the rate at which the team is scoring. You will look at all this and decide whether he requires hitting big shots or playing safe.
Similarly, stock market indicators assist the traders. They observe old prices, see whether the stock is moving too fast, and attempt to get any indication of change. These indicators are calculated according to definite formulas, which assist people in making decisions to purchase or sell shares.
Here are some of the most commonly used technical indicators.
Moving Averages
A moving average in technical analysis is a line that represents the average daily price for a stock over a determined number of days. The moving average smooths out the relevant highs and lows in order to dampen the noise and better show overall shifts in the trend, whether the price is up, down, or relatively flat.
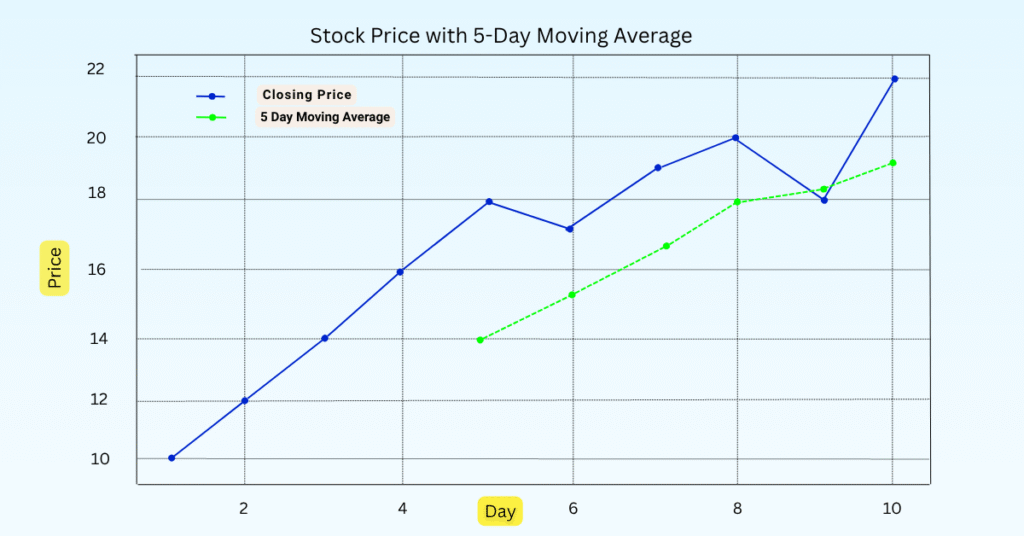
A simple example of moving averages
Let’s say you have a stock with the closing prices for 5 days:
10, 12, 14, 16, 18
Add them: 10 + 12 + 14 + 16 + 18 = 70
Divide by five: 70 ÷ 5 = 14.
So the 5-day moving average is 14.
Each day, the average would “move over”, dropping the oldest price and adding the newest. Hence, a moving average.
It allows traders to see, with more clarity, a direction in the market.
Relative Strength Index (RSI)
RSI (Relative Strength Index) is a number between 0 and 100 that shows whether a stock is overbought (price too high) or oversold (price too low).
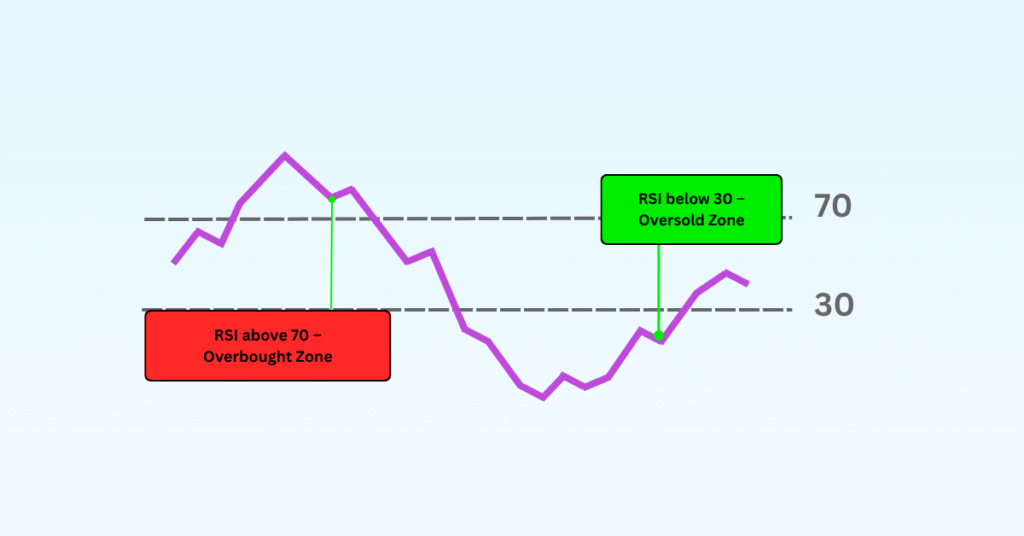
- If RSI is above 70, the stock might be overbought (can fall soon).
- If RSI is below 30, the stock might be oversold (can rise soon).
Simple meaning:
It tells you if the stock price has gone up or down too much, too quickly.
Formula of RSI:
RSI = 100 − (100 ÷ (1 + RS))
Where:
RS = Average Gain over 14 days ÷ Average Loss over 14 days
So, it compares how much the stock goes up vs how much it goes down in the last 14 days (by default).
Bollinger Bands
Bollinger Bands is a tool that tells you if a stock price is either overvalued or undervalued, based on the average price in recent periods. There are three lines in a band:
Middle line: the average price over the last 20 periods
Upper line: average + mentioned standard deviation times 2
Lower line: average – mentioned standard deviation times 2
If the price touches the band above, it might be overbought. If it touches the band below, it could be oversold. The bands also show you how much the price is moving—if the bands are wide, this tells you that the price is moving more.
Bollinger Bands formula:
Middle Band = Simple Moving Average (SMA) 20-day
Upper Band = SMA + (2 × Standard Deviation)
Lower Band = SMA – (2 × Standard Deviation)
This means it’s taking the average price over 20 days and adding or subtracting the normal amount the price moves (standard deviation) to create the bands.
How to Use Technical Indicators in Trading Strategies
To effectively use technical indicators, it’s important to understand how they fit into your overall trading strategy. Here are some tips:
Combine Indicators for Better Signals
Using a single indicator could lead to blurry signals. An indication with many types of information, like MACD (trend) coupled with RSI (momentum), can help provide confirmation to trends, reducing a trader’s chances of receiving false signals. Improving traders’ accuracy even further allows for the trader to cross-reference the signals received to grasp a wider market condition.
Understanding Indicator Limitations
The technical indicators are really helpful, but they too have their limits; they are based on the past price data and can sometimes also give false signals.
Here are the limitations of technical indicators.
- Based on past data, not future events
- Can give false signals in volatile markets
- Don’t consider news or sudden events
- May lag behind real-time price changes
- Need confirmation from other tools or analysis
Backtesting Strategies
Before applying a new indicator in actual trade, it would be wise to test it on prior market data; this process is called backtesting. Backtesting indicates how your trading strategy would have performed in the past, which allows you to see how valuable the new indicator is, identify mistakes, and improve your trading strategy.
Why Backtesting is Useful:
- Shows if your strategy works or not
- Helps avoid losses before using real money
- Let you adjust the plan for different market conditions
- Makes your trading strategy stronger and more flexible
Let’s have a look at combining indicators as trading strategies.
Moving Average Crossover
In this strategy, two moving averages are used, one is short-term and on long-term.
When the short-term line goes above the long-term line, it gives a buy signal. When it goes below, it gives a sell signal. This helps traders spot changes in market direction.
Why It’s Popular:
- Easy to understand and use
- Gives clear entry and exit points
- Works well for spotting trend changes
- Useful for both beginners and experienced traders
RSI Divergence
RSI divergence occurs when the RSI moves in the opposite way to the price. For example, RSI might be going lower while price is higher, which may signal a potential trend reversal. Effectively, RSI divergence can help traders identify changes before they occur.
Why Traders Use It:
- Helps predict trend reversals early
- Can signal hidden market weakness or strength
- Works better when combined with other indicators
- Improves decision-making and trade timing
Technical indicators are powerful tools that can enhance your trading strategies by providing valuable insights into market trends and potential price movements. However, they should be used as part of a comprehensive trading plan that includes risk management and a solid understanding of market conditions. By combining different indicators, understanding their limitations, and continuously refining your strategies, you can improve your trading performance and make more informed decisions.
Congratulations on completing the blog. I hope you understood something new related to technical indicators. If you want to explore other topics related to the stock market, mutual funds, crypto, or overall finance, don’t forget to follow StofiniQ!
Reference:
I left my engineering job to follow my true passion writing and research. A passionate explorer of words and knowledge, I find joy in diving deep into topics and turning rich, insightful research into compelling, impactful content. Whether it’s storytelling, technical writing, or brand narratives, I believe that the right words can make a real difference.
Oh my goodness! an amazing article dude. Thanks However I am experiencing challenge with ur rss . Don’t know why Unable to subscribe to it. Is there anyone getting equivalent rss downside? Anyone who is aware of kindly respond. Thnkx