Introduction to RSI Indicator
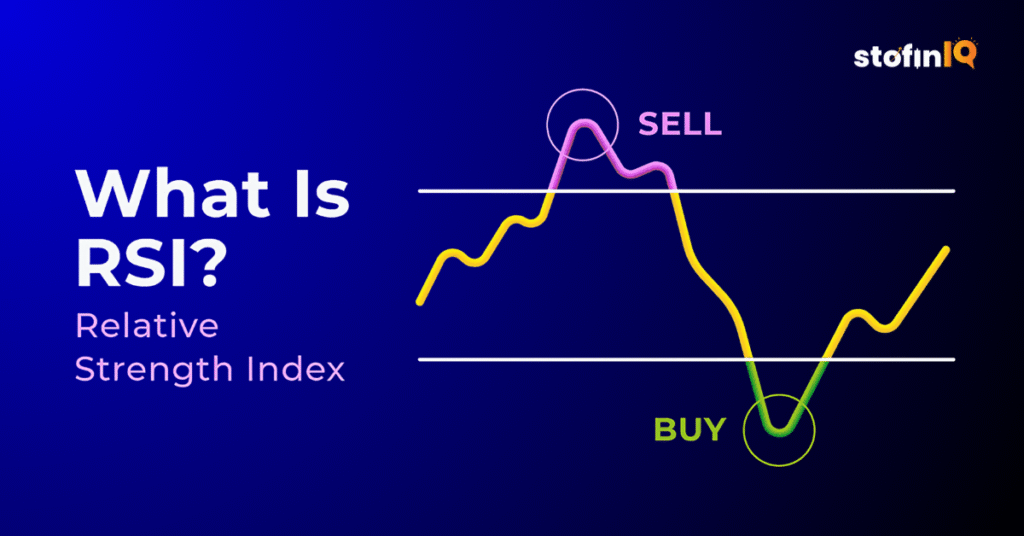
RSI is a very helpful technical tool whose purpose is to help traders read the momentum in a price. In simple terms, it assists you in determining whether a stock or coin has been rising too quickly (and is likely to fall soon) or falling too rapidly (and is likely to rise soon). It provides you with a number between 0 and 100 to indicate this.
The indication of whether an asset is overbought or not is observed when the RSI is in the region above 70, since it indicates a price decrease.
Once it is below 30, then the asset is oversold – this could mean a retracement of the prices.
In this blog, we will present an analysis of what RSI indicator is, how to read the RSI, and even how you can use RSI to further your trading career with real examples and easy, quick tips.
Key Takeaways
- Definition: RSI (Relative Strength Index) is a momentum indicator, which is used to show the speed and the strength of a price movement on a scale of value between 0 and 100 to assist traders in detecting possible reversals.
- Overbought/Oversold Levels: An RSI level above 70 indicates the asset is overbought (it may soon decrease), whereas below 30 indicates it is oversold (and it may soon increase).
- Default Setting: The default setting of the RSI indicator is 14 periods that fits most of the trading types and periods.
- RSI Formula: RSI = [100 /(1 + Average Gain/ Average Loss)] RSI = (100-1/ (1+Average gain/Average loss)) RSI is computed over the selected period.
- Divergences: The difference between RSI and price movement (price increasing and RSI decreasing) could be an indicator of a trend reversal.
- Entry/Exit Timing: Traders apply RSI in identifying the best entry in terms of buying (oversold) or exiting (overbought).
- Combinations with Other Tools: The RSI makes the combination of other tools more effective in terms of MACD indicators, moving averages, or trendlines.
- Customizable: The indicators can be configured (such as RSI 9 or 21) to align with day trading, swing trading, or long-term investment.
What is the Relative Strength Index (RSI)?
Relative Strength Index or RSI is a tool to be used by traders in trying to determine the price strength of a stock or other item. It is kind of a warning letting you know when you have bought too many or sold too many within a small duration.
Take the case where you are looking at a stock that is going higher and higher each day. At one point, it may have moved beyond, or it may have moved too fast, and it may even fall soon.
Conversely, when a stock is continuously on a decline, there is a probability that it will rebound soon. The RSI indicator will assist you in identifying these moments by showing you when an asset is either overbought or oversold.
What is RSI (In Simple Words)
RSI is a figure between 0-100 in a range indicating that a stock or an asset is probably overbought or oversold.
When the RSI is higher than 70, then it is normally an indication that the asset is overbought, and this can be expected to bring the price down in the near future.
When the RSI is less than 30, it typically indicates that the asset is oversold – the increase of price increase can be expected shortly.
History and Development of RSI
Relative Strength Index (RSI) was invented by a technical analyst under the name J. Welles Wilder Jr. He first presented it in a book written in the year 1978 titled; new concepts in technical trading systems.
Back then, traders did not possess powerful charting programs; tools such as RSI provided an easy and immediate measure of price momentum. It assisted them to comprehend when a stock was becoming excessively expensive (Overbought) or cheap (oversold).
Regardless of the fact that it was created more than 40 years ago, RSI indicator remains confident and accepted even today by millions of traders all over the world, both newcomers and professionals. The reason it has passed the test of time is its uncomplicated nature, its accuracy, and the fact that it provides prompt signals in active markets.
Why RSI is Important in Technical Analysis
The RSI indicator is useful in enabling traders to know how firm and fast a price move is, and it is not necessary that the trader guess that a stock or a crypto must be too high or that it is too low. RSI provides a visual indication of a value between 0 and 100
Shows Overbought and Oversold Conditions
RSI notifies when a particular asset is either overpriced (overbought) or underpriced (oversold). This helps you spot a possible trend reversal
Helps Time Your Entry and Exit
The RSI indicator can be used in determining the purchase time as well as the selling time. Take an example of traders, some tend to view RSI at low levels below 30 as an opportunity to purchase. When it rises above 70, then it is time to sell high.
Works with Other Indicators
RSI doesn’t have to be used alone. It is also compatible with other indicators such as moving averages, MACD and trend lines to provide better confirmation.
Easy to Read
RSI does not require anyone to be a genius in math. As soon as you know the basic concepts of the rule of 70 and 30, it is a simple and convenient guide.
Works in Different Markets
RSI is not just for stocks. It is employed in crypto trading, forex, commodities and even index trading.
How the RSI Works

Traders employ RSI as an indicator of when a price may turn around, such as when to buy following a decline, or when to sell when a price swings up strongly.
RSI moves on a scale from 0 to 100:
Above 70-The asset is overbought (price can fall down)
Below 30- In this case, it is oversold (price could rise)
30 to 70 -The asset is in the normal or neutral zone
The RSI is displayed in most trading platforms as a line beneath the main price chart, and as such, it is quite easy to interpret even by first-time traders.
RSI Formula Explained
Don’t worry — the RSI formula may look complicated at first, but you don’t need to memorise it. Most trading apps calculate it for you. Still, it’s helpful to understand what’s happening behind the scenes.
The Formula:
RSI = 100 – [100 / (1 + RS)]
Where:
- RS = Average Gain over the last 14 periods ÷ Average Loss over the last 14 periods
Let’s break this down:
- The RSI looks at the last 14 time periods (for example, 14 days if you’re using a daily chart).
- It checks how much the price went up on average during that time (called the average gain).
- Then it checks how much the price went down on average during that time (called the average loss).
- It compares the two using the RS (Relative Strength), then turns it into a number between 0 and 100.
Simple Idea:
- If prices mostly went up, the RSI number would be high.
- If prices mostly went down, the RSI number will be low.
This is what helps the RSI tell you if something is overbought (above 70) or oversold (below 30).
Step-by-Step RSI Calculation (With Detailed Examples)

We’ll calculate RSI using the standard 14-day period. Below is a clear breakdown of how it’s done.
Step 1: Find Daily Price Changes
Suppose you have these 15 closing prices (Day 1 to Day 15):
45, 46, 47, 46, 48, 49, 50, 49, 51, 52, 51, 50, 51, 52, 53
Now, calculate the change in price for each day (starting from Day 2):
Day 2 – Day 1: 46 – 45 = +1 (gain)
Day 3 – Day 2: 47 – 46 = +1 (gain)
Day 4 – Day 3: 46 – 47 = -1 (loss)
Day 5 – Day 4: 48 – 46 = +2 (gain)
Day 6 – Day 5: 49 – 48 = +1 (gain)
Day 7 – Day 6: 50 – 49 = +1 (gain)
Day 8 – Day 7: 49 – 50 = -1 (loss)
Day 9 – Day 8: 51 – 49 = +2 (gain)
Day 10 – Day 9: 52 – 51 = +1 (gain)
Day 11 – Day 10: 51 – 52 = -1 (loss)
Day 12 – Day 11: 50 – 51 = -1 (loss)
Day 13 – Day 12: 51 – 50 = +1 (gain)
Day 14 – Day 13: 52 – 51 = +1 (gain)
Day 15 – Day 14: 53 – 52 = +1 (gain)
Now count the total gains and losses:
Gains: 1, 1, 2, 1, 1, 2, 1, 1, 1, 1 = Total gain = 12
Losses: 1, 1, 1, 1 = Total loss = 4
Step 2: Calculate Average Gain and Average Loss
Since we’re using 14 periods, divide the total gains and losses by 14.
Average Gain = 11 ÷ 14 = 0.7857
Average Loss = 3 ÷ 14 = 0.2142
Step 3: Calculate RS (Relative Strength)
RS = Average Gain ÷ Average Loss
RS = 0.7857 ÷ 0.2142 = 3.67 (approximately)
Step 4: Calculate RSI
Use the RSI formula:
RSI = 100 – [100 / (1 + RS)]
RSI = 100 – [100 / (1 + 3.67)]
RSI = 100 – [100 / 4.67]
RSI = 100 – 21.4
RSI = 78.6 (approximately)
Final Result:
The RSI value is 78.6. This means the stock is in the overbought zone (since it’s above 70), and the price may soon come down.
Default RSI Settings and Timeframes
When you open a trading chart and you add RSI indicator, it automatically has default settings that are generally applied by majority of traders most especially the beginners. The settings are developed to provide a stable and well-balanced perception of the price momentum.
Default RSI Settings:
Period: 14
What this means is that RSI is computed with the last 14 candles, days, hours, or minutes, as the case will be, in response to the span of time settings in which you find yourself on the chart.
This number was recommended by J. Welles Wilder, the creator of RSI, and is still very often used.
Overbought level: 70
When RSI exceeds 70 then it can indicate that the asset is overbought and is about to experience a decline.
Oversold level: 30
When RSI is below 30, then it can be interpreted as the asset is oversold and it may rebound.
Common Timeframes Used with RSI
The timeframe you choose changes how RSI behaves. Here’s how:
1-minute-15-minute charts: Intraday or scalper traders.
RSI is sensitive to minor price changes, but it may present a greater number of false alarms.
4-hour up to 1-hour charts:
suitable to use in short- to medium-term trades. RSI is more stable here.
Daily charts:
Most reliable for swing and position trading. RSI signals are slower but stronger.
Weekly charts:
Applied to long-term investors to capture large market reversals.
Tip:
The RSI settings can be adjusted. There are traders who utilize RSI 9 or RSI 21 to suit their plan.
The setting of a lower period (such as 9) causes RSI to be more sensitive – it responds quicker.
When the period is higher (such as 21), RSI becomes less erratic and therefore more accurate signals are generated.
How to Read RSI Values

Learning to read RSI is not difficult especially when you know the meaning of the numbers. RSI will provide you with the number which will lay between 0 and 100 and which will indicate how powerful the current price trend is either buyers or sellers are in power.
Here’s how to read those values:
1. RSI above 70 – Overbought Zone
Its price has increased too high and too fast.
It can be too high a price, and soon the price may decrease.
Traders often prepare to sell or wait before buying.
2. RSI below 30 – Oversold Zone
The price has dropped too much and too fast.
It is perhaps too cheap, and a bounce or reversal can take place
Traders often look for buying opportunities here.
3. RSI between 30 and 70 – Neutral Zone
The price is stable.
No strong signal to buy or sell.
Most of the traders remain sceptical and observe the RSI to get closer to 30 or 70.
Overbought and Oversold Conditions
- Overbought: This means that the asset has risen too far, too fast, and a price correction is likely. RSI > 70.
- Oversold: This means that there is an excessive selling pressure, hinting at a potential price rebound. RSI < 30.
These levels help traders set entry/exit triggers and stop-loss zones.
Divergences: Bullish vs Bearish RSI Signals

A potentially effective ability of using the RSI indicator is in highlighting divergences. A divergence occurs when the cost of a share or a commodity rises in reverse to the price of the RSI indicator. This may be an indication that the existing trend is declining, and a reverse event may occur shortly.
RSI divergence occurs in two forms: bullish divergence and bearish divergence.
1. Bullish Divergence (Buy Signal)
This happens when:
- The price is making lower lows,
- But the RSI is making higher lows.
What does it mean?
Although the price is declining, there are dwindling influences behind the selling. This may indicate that the downtrend action is weakening, and the price will rise soon.
Traders see this as a possible buying opportunity.
Example:
The price settles at the new low, whereas RSI does not decrease so much as it increases a little. It is a sign to note that the sellers are weakening.
2. Bearish Divergence (Sell Signal)
This happens when:
- The price is making higher highs.
- But the RSI is making lower highs.
What does it mean?
There is increased price value, yet the purchasing power is diminishing. This may imply that the uptrend is becoming weaker, and hence the price might fall soon.
This is regarded as a sign to make a profit by traders or prospective sellers.
Example:
The price reaches the new high, however, RSI does not reach the new high: it reaches the previous high. That’s a sign of weakness in the trend.
Why Divergence Matters
Divergence is not a daily occurrence, but when it is it may be a good indication that a trend is about to change. Divergence is also used by many traders to confirm their trades accompanied with support and resistance levels or candlestick patterns.
RSI vs Other Momentum Indicators (MACD, Stochastic, etc.)
There are many tools to measure price momentum. It is the most popular; other well-used ones include MACD and Stochastic Oscillator indicators. Here’s a quick comparison:
1. RSI (Relative Strength Index)

Range: 0–100
- Above 70 = Overbought, Below 30 = Oversold
- Best for spotting price reversal zones
- Simple and fast
2. MACD (Moving Average Convergence Divergence)

- Based on moving averages
- Shows trend direction and momentum
- Good for confirming long-term trend changes
- Slower than RSI
3. Stochastic Oscillator

Range: 0–100
- Above 80 = Overbought, Below 20 = Oversold
- Very sensitive, works well in sideways markets
- Can give many signals (more noise)
Summary:
- Use RSI for quick overbought/oversold signals.
- Use MACD for trend confirmation.
- Use Stochastic for fast entries in choppy markets.
Common Mistakes When Using RSI
- Using only RSI and not the price structure analysis
- Averting the insidious breakouts in volatile markets
- Overtrading on each case of the overbought/oversold signal
- The failure to scale the timeframes according to volatility
Try not to use RSI as a standalone system; use it in combination with support/resistance, moving averages, and volume for accuracy
Best Strategies Using RSI Indicator
RSI + Trendline Breakout

- Look for RSI oversold/overbought near a trendline.
- Buy when the price breaks the trend in the reverse direction.
RSI Divergence Strategy

- Price and RSI are moving in opposite signals momentum shift.
- Use it to catch early reversals before they confirm.
50-Level Cross Strategy
- RSI above 50 shows bullish strength, go long.
- Below 50 signals bearish momentum, go short.
RSI with Moving Averages

- Combine RSI with trend direction from moving averages.
- Trade setups on RSI only when they are in synch with the bullish or bearish ones.
Real Chart Examples of RSI in Action

- BTC/USD RSI hitting lower than 30 – price was up 15% boost in the next 3 days
- AAPL RSI divergence spotted before earnings sell-off
- ETH/USD RSI broke 70, triggering a short-term correction
You can compare RSI with price action using TradingView or MetaTrader and see its relative strength with a visual example.
Using TradingView or MetaTrader, you can easily overlay RSI with price action to visually study its predictive power.
RSI Settings for Day Trading vs Swing Trading
| Trading Style | RSI Period | Signal Use |
| Day Trading | 5 – 9 | Fast signals, high frequency |
| Swing Trading | 14 | Balanced signals, medium trades |
| Position Trading | 21+ | Long-term confirmation |
Adjust your RSI settings as per the volatility and timeframe of the asset.
Combining RSI with Other Technical Indicators
Moving Averages: For trend confirmation.
MACD: For convergence/divergence confirmation.
Bollinger Bands: For volatility-based breakouts.
Volume Profile: For validating RSI signals with market strength.
Combining RSI with other tools increases confidence and reduces the risk of failure in trading.
Limitations of the RSI Indicator
- Generates false signals in ranging markets
- Poor performance in strong trending assets
- Needs confirmation from other indicators
- Does not reflect external factors (news, fundamentals)
Despite its drawbacks, RSI is an essential part of every trader’s toolbox when used appropriately.
Conclusion: Mastering RSI in Your Trading Strategy
The RSI is a great technical indicator for understanding market momentum, reversals, and potential entry points. Becoming a master of RSI through divergences, trend confirmation, and strategic combinations with other technical indicators can improve your trading performance.
Congratulations on making it to the end of the blog! Follow StofinIQ to learn more about stocks, shares, mutual funds, and the overall share market.
Frequently Asked Questions (FAQs)
RSI can tell you if an asset is overbought or oversold, which helps traders identify potential reversals.
The items that are below 30 are considered oversold, and these items can indicate a buying opportunity.
Yes, the RSI is used a lot in cryptocurrency trading to assess momentum and price extremes.
RSI 14 is the calculation of the average and losses over 14 periods. It is the default setting.
They serve different purposes. RSI is faster and better for extremes, while MACD is ideal for trend strength.
Both RSI and MACD serve different purposes.RSI is faster and better for the extremes,and on the other hand MACD is ideal for trend strength.
If the price makes a lower low and the RSI makes a higher low, it means that there is a possible upward reversal.
Yes, mainly in strong trends. Always try to confirm RSI signals with other indicators.
Traders are fond of using a 14-period RSI on 1-hour, 4-hour, or daily charts.
To verify the direction of the trend when RSI sends a signal, make use of moving averages.
Yes, but the settings need to be adjusted based on the time horizon and the volatility.
I left my engineering job to follow my true passion writing and research. A passionate explorer of words and knowledge, I find joy in diving deep into topics and turning rich, insightful research into compelling, impactful content. Whether it’s storytelling, technical writing, or brand narratives, I believe that the right words can make a real difference.