Introduction
Fundamental analysis and technical analysis are two topics on which beginners often get confused. Fundamental analysis is all about determining a company’s intrinsic value (true value), while technical analysis is about understanding charts and patterns.
To choose the best for you is essential; this blog talks about the details of both fundamental analysis and technical analysis.
Key Takeaways
- The fundamental analysis considers the intrinsic (true) value (the real worth) of a company, which means it looks at all the factors such as financial health, management, industry, and economy in order to establish the real worth of a company.
- The technical analysis focuses on stock price changes and patterns of stock price movement, which are obtained through stock price charts.
- Fundamental analysis is best for long investment strategies!
- Technical analysis methods are best employed for short-term trading.
- Both fundamental analysis and technical analysis use such as financial statements and valuation models including DCF, P/E, and other assets are all underlying analysis of a company’s fundamentals.
- Technical analysis uses price charts, indicators, and market trends (statistical methods).
- The two methods, fundamental and technical analysis, have different objectives, but they both can be used together.
- Use fundamental analysis to establish what you should buy, and use technical analysis to determine when to buy/sell.
What is fundamental analysis?
Fundamental analysis simply means calculating the intrinsic value of a company.
But what is the intrinsic value?
Intrinsic value is the real value of a company; this value is not calculated based on the current trade but rather it is calculated using a complex economic model.
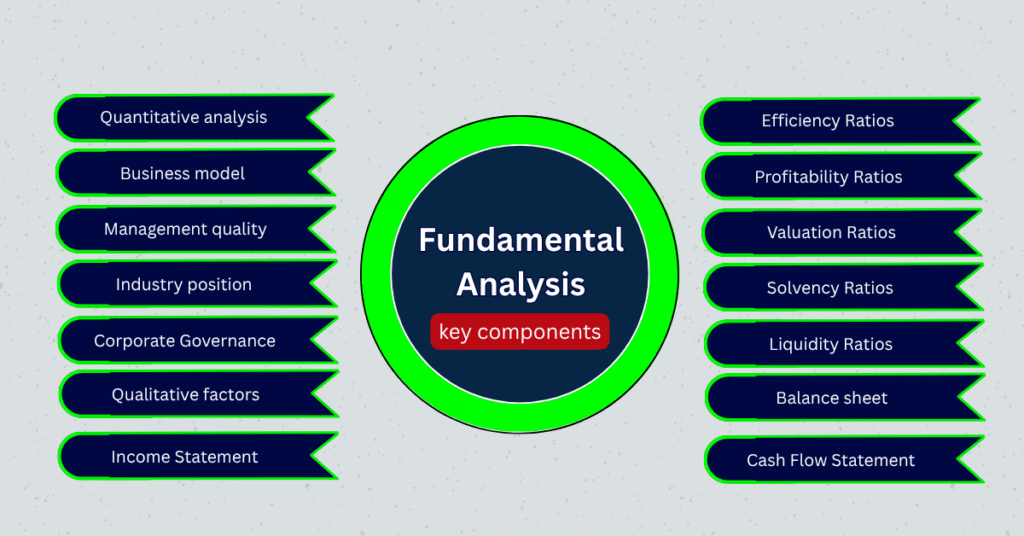
The key components of fundamental analysis are
Quantitative analysis
These are the non-calculative factors, like business management and the strength of the company.
Business model
Analysing the business model simply means understanding how the company earns money.
Management quality
The skills and the integrity of the team.
Industry position
This is the rank of the corporation and the influence within the sector.
Corporate Governance
All the ethical rules that govern the corporate environment and the practices that guide the company management
Qualitative factors
This is the numerical analysis of the financial ratios
Income Statement
The revenue, expenses and the profit/loss over a period
Balance sheet
The balance sheet displays equities and assets.
Cash Flow Statement
Tracking actual cash inflow and outflow.
Profitability Ratios
The measure of how effective the company is in generating profit.
Liquidity Ratios
The liquidity ratio is the ability of the company to pay short-term obligations.
Solvency Ratios
This is the long-term financial stability and the debt levels of the company.
Efficiency Ratios
The efficiency ratios show how well the company use its resources to generate maximum profit.
Valuation Ratios
The valuation ratio helps in determining if the stock is overvalued or undervalued.
What is financial statements analysis?
Financial statements are an important part of fundamental analysis. They reveal the financial health of a company. Investors can assess performance and possible risks by conducting an analysis of the documents.
- Balance Sheet: Shows assets, liabilities, and shareholder equity.
- Income Statement: Details revenue, expenses, and net income.
- Cash Flow Statement: Tracks cash inflows and outflows over time.
Overall, financial statement analysis will aid personal investors in the assessment of profitability, operating efficiency, and liquidity. Additionally, personal investors will benefit from understanding these aspects to evaluate the resilience of a company and its future growth prospects.
How to calculate the intrinsic value of a stock?
There are different methods to calculate the intrinsic value.
1. Discounted Cash Flow (DCF) Method
Use case: Suitable for companies with predictable and stable future cash flows.
Steps:
-
- Estimate the company’s free cash flows (FCFs) for the next 5–10 years.
- Choose an appropriate discount rate (usually the company’s weighted average cost of capital, or WACC).
- Calculate the present value of each year’s cash flow using the discount rate.
- Estimate the terminal value (value beyond the forecast period).
- Add the present value of the cash flows and the terminal value.
- Divide the total by the number of outstanding shares to get the intrinsic value per share.
Formula:
Intrinsic Value = ∑ (FCFₜ / (1 + r)ᵗ) + Terminal Value / (1 + r)ⁿ
where:
-
- FCFₜ = free cash flow in year t
-
- r = discount rate
-
- n = number of forecast years
2. Dividend Discount Model (DDM)
Use case: Best for companies that pay consistent and predictable dividends.
Formula (Gordon Growth Model): Intrinsic Value = D₁ / (r-g)
where:
-
- D₁ = expected dividend next year
-
- r = required rate of return
-
- g = dividend growth rate
3. Earnings Multiplier Approach (P/E-Based Valuation)
Use case: Companies with steady earnings and no significant irregularities.
Formula:
Intrinsic Value = EPS × Justified P/E Ratio
-
- EPS = Earnings Per Share
-
- Justified P/E can be based on the industry average or expected growth
4. Net Asset Value (Book Value Approach)
Use case: Asset-heavy industries like real estate or manufacturing.
Formula:
Intrinsic Value = (Total Assets – Total Liabilities) / Shares Outstanding
You can also adjust for intangible assets or revalue undervalued assets.
5. Relative Valuation (Comparable Company Analysis)
Use case: Comparing a company to its peers.
Involves using valuation multiples such as
-
- Price to Earnings (P/E)
-
- Price to Book (P/B)
-
- Price to Sales (P/S)
-
- Enterprise Value to EBITDA (EV/EBITDA)
Compare these with industry averages or competitors to assess if a stock is overvalued or undervalued.
6. Residual Income Model
Use case: Companies that do not pay dividends and have uncertain cash flows.
Formula:
Intrinsic Value = Book Value + ∑ (Residual Income / (1 + r)ᵗ)
Residual Income = Net Income – (Equity Capital × Cost of Equity)
What is Technical Analysis?
Technical analysis is a way of studying stocks and prices by examining the charts and patterns. By understanding the charts and patterns, the traders do not have to check the company’s financial statements.
Thus, by checking the charts and patterns, the traders can understand when to buy or sell the stock.
What are the Key components of Technical analysis?
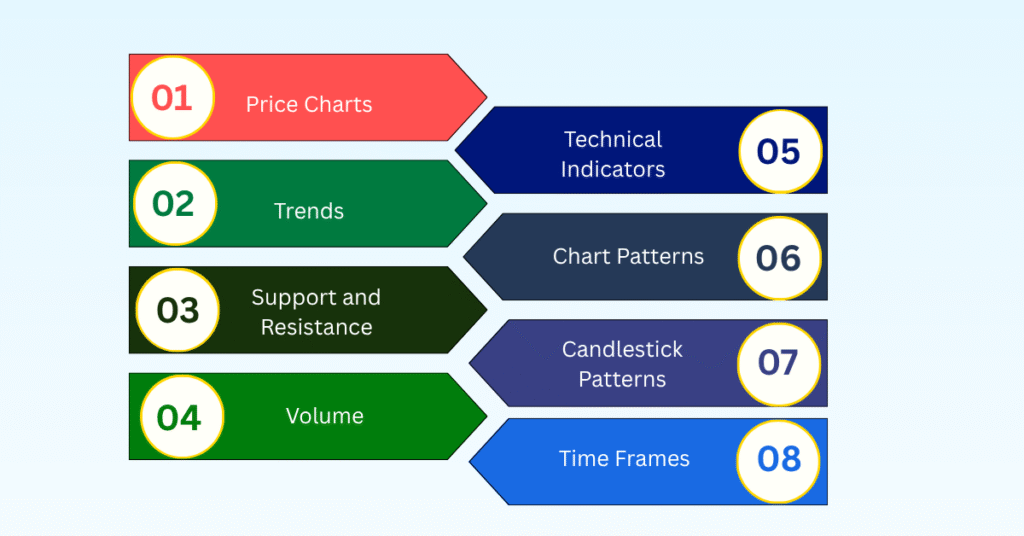
The key components of technical analysis are
Price Charts
Visual representation of a stock’s price over time (like line charts, bar charts, and candlestick charts).
Trends
The general direction in which the price is moving (uptrend, downtrend, sideways).
Support and Resistance
Support is a price level where the stock tends to stop falling; resistance is where it tends to stop rising.
Volume
The number of shares traded helps confirm the strength of a price move.
Technical Indicators
Tools like Moving Averages, RSI, and MACD help identify momentum, trend strength, and possible reversals.
Chart Patterns
Shapes like Head and Shoulders, Triangles, and Flags that suggest potential future moves.
Candlestick Patterns
Specific candle shapes (like doji and hammer) that give clues about market sentiment.
Time Frames
The period being analysed (like 5-minute, daily, or weekly charts) depends on short-term or long-term trading.
Chart Patterns in Technical Analysis
What are chart patterns?
Chart patterns are the shapes created by price movement on the charts of a stock. Patterns allow traders the ability to identify the likely action for the price next. Patterns can be defined as continuation patterns (example: triangles, flags) or reversal patterns (example: head and shoulders, double top / double bottom). Chart pattern recognition can give traders the ability to make better decisions on when to buy or sell.
This is a list of common chart patterns used in technical analysis:
Reversal Patterns (signal a change in trend):
- Head and Shoulders
- Inverse Head and Shoulders
- Double Top
- Double Bottom
- Triple Top
- Triple Bottom
Continuation Patterns (signal the trend will likely continue):
- Flags
- Pennants
- Rectangles
- Triangles
- Ascending Triangle
- Descending Triangle
- Symmetrical Triangle
Other Patterns:
- Cup and Handle
- Rounding Bottom
- Wedges
- Rising Wedge
- Falling Wedge
Technical Indicators for Trading
What are technical indicators in trading?
Technical indicators are used in trading to study price and volume fluctuations. They are based on mathematical algorithms that traders employ to find trends, determine momentum, see volatility, and anticipate potential price reversals. Technical indicators are not used to assess company performance or news, but rather they help to inform whether traders should buy or sell by looking back on past prices.
Common types of technical indicators:
- Trend Indicators – Show the direction of the market
- Moving Averages (MA)
- Moving Average Convergence Divergence (MACD)
- Moving Averages (MA)
- Momentum Indicators – Measure the speed of price movements
- Relative Strength Index (RSI) To know more about RSI, you can check out this blog: Relative Strength Index (RSI) Indicator Explained With Formula
- Stochastic Oscillator
- Relative Strength Index (RSI) To know more about RSI, you can check out this blog: Relative Strength Index (RSI) Indicator Explained With Formula
- Volatility Indicators—Show how much the price is moving
- Bollinger Bands
- Average True Range (ATR)
- Bollinger Bands
- Volume Indicators – Analyse trading volume
- On-Balance Volume (OBV)
- Volume Moving Average
- On-Balance Volume (OBV)
These indicators help traders make informed decisions about when to enter or exit a trade.
Fundamental Analysis vs Technical Analysis: A Comparison
Fundamental analysis is about understanding the intrinsic value of the underlying company. It includes analysis of company financial statements, economic indicators, and industry conditions.
Technical analysis, or to forecast stock market trend, takes a close look at price and volume. Understanding both fundamental and technical analysis can give you a fuller understanding of the market.
Methodological differences between technical analysis and fundamental analysis
- Technical Analysis:
Studies past market data—mainly price and volume—to predict future price movements.
Example: Using chart patterns or indicators like RSI and MACD. - Fundamental Analysis:
Examines a company’s financial health, performance, and external factors to determine its intrinsic value.
Example: Analysing balance sheets, earnings reports, and industry trends.
2. Data Used
- Technical:
Historical price charts, trading volume, market trends, and technical indicators. - Fundamental:
Revenue, profit, assets, liabilities, management quality, and macroeconomic conditions.
3. Time Horizon
- Technical:
Often short-term (minutes, days, weeks), used by traders. - Fundamental:
Long-term perspective, used by investors.
4. Tools and Techniques
- Technical:
Candlestick charts, trendlines, support/resistance levels, indicators (RSI, MACD, Bollinger Bands). - Fundamental:
Financial ratios (P/E, P/B, ROE), earnings reports, economic indicators, and industry research.
5. Assumption
- Technical:
Price reflects all available information. Patterns repeat due to market psychology. - Fundamental:
The market may misprice a stock in the short term, but the price will align with value over time.
In short:
Technical analysis looks at “what the market is doing”;
Fundamental analysis looks at “why the company is worth investing in.”
Advantages of Fundamental Analysis
The following are the major advantages of fundamental analysis:
True Value Determination: Determines a stock’s intrinsic (real) value by evaluating the current condition and future growth potential of the company’s financial outlook.
Long-Term Orientation: Great for investors wishing to keep stocks for years rather than days.
Risk Awareness: By understanding the company’s fundamentals, investors can avoid overvalued and/or weak businesses.
Knowledge-Based Decisions: Fundamental analysis gives investors the information (e.g. earnings, debt, cash flow, and quality of management) to make informed, complex decisions.
Economic Conditions: Macroeconomic factors (interest rates, inflation, and GDP) also contribute to the fundamental analysis model for investors.
Long-Term Investment Plan:
Fundamental analysis supports a long-term investment strategy by assessing companies with a solid base. These companies will likely build upon their strength in the future and survive market fluctuations. This will benefit those investing for years as they will realise substantial growth of their stock value.
Understanding Stock Market Patterns:
By monitoring earnings growth, sector growth, and economic indicator,s an investor will have a better understanding of why the markets move in the direction they do. The investor will tie the performance of the company affecting market shares to the overall behavior of a certain sector to give extra perspective of that sector’s trend formation.
Advantages of Technical Analysis
Here are the main advantages of technical analysis:
Speed: Technical analysis allows for quick decision-making during live entry and exit based on charts.
Visualisation: Price charts and indicators allow for visualisation of market price trends and patterns.
Timing: Technical analysis can assist with timing the ideal moments to buy and sell based on patterns and signals.
Universality: Technical analysis can encompass various asset classes such as stocks, commodities, forex, and cryptocurrencies.
Emotion: Technical analysis operates under data rules, meaning there is less guesswork involved.
Price action trading: It is understood that price action trading is a part of technical analysis, with decisions being made simply on price behaviour without relying on many indicators. Price action traders base their decisions on candlestick patterns, levels of support/resistance, and momentum to read the market.
Short-term trading opportunities: Technical analysis is especially beneficial for day traders or swing traders since it will allow them to quickly identify trading opportunities based on patterns, trend reversals, and breakouts which will be overlooked by longer term traders who primarily rely on fundamental analysis.
Risk Management in Trading
Risk management is an important component for success while trading. Risk management is defined as setting rules and establishing limits to ‘protect’ your capital. Just as with fundamental and technical analysis, risk management should be first and foremost.
There are many ways traders can limit their losses while achieving reasonable returns and also avoid making emotional decisions while trading. Following rigid guidelines allows traders to remain disciplined in an indeterminate market.
• Position Sizing: Assigning their assets to strictly control risk
• Stop-Loss Orders: Setting predetermined levels to exit losing trades;
• Risk Reward Ratios: Compares driving returns against driven losses.
Risk management is your safety net that allows you to endure uncertain market environments without drastically damaging your portfolio.
Conclusion: Which Strategy Should You Choose – Technical Analysis or Fundamental Analysis?
Choosing between technical and fundamental analysis comes down to your investment goals, time horizon and trading style.
If you’re a long-term investor committed to providing wealth accumulation over time in strong companies with solid financials, fundamental analysis is the better choice as this will allow you to learn the company’s actual worth and make informed decisions based on both economic and business factors.
If you’re a short-term trader trying to make money with price movement, trends and market timings, technical analysis is the right way to go at it; it will allow you to quickly react to the market signals with its tools through charts, indicators and patterns.
Some of the best traders and investors incorporate both methods of investing together—using fundamental analysis to determine what to buy, while using technical analysis to determine when to buy or sell.
In summary:
- Choose fundamental analysis for long-term investing.
- Choose technical analysis for short-term trading.
- Or, use both at the same time for a blended strategy.
Congratulations on finishing the blog!
If you want to dive deeper into the world of trading, don’t forget to check out more blogs on StofinIQ. If you’re genuinely interested in learning about the stock market, investing, trading, or the technical and fundamental analysis of stocks, mutual funds, IPOS, or anything related to making money from the market, subscribe to our channel.
Reference:
Technical Analysis: What It Is and How to Use It in Investing
I left my engineering job to follow my true passion writing and research. A passionate explorer of words and knowledge, I find joy in diving deep into topics and turning rich, insightful research into compelling, impactful content. Whether it’s storytelling, technical writing, or brand narratives, I believe that the right words can make a real difference.


Perfectly indited subject matter, thanks for information. “The last time I saw him he was walking down Lover’s Lane holding his own hand.” by Fred Allen.
This is the right blog for anyone who wants to find out about this topic. You realize so much its almost hard to argue with you (not that I actually would want…HaHa). You definitely put a new spin on a topic thats been written about for years. Great stuff, just great!
Perfect piece of work you have done, this web site is really cool with wonderful information.