Introduction to Intraday Trading
Pros and Cons of Intraday Trading
Pros
- Potential for quick profits
- Low capital requirement due to margin
- No overnight risk
- Frequent trading opportunities
Cons
- High risk exposure
- Requires full-time attention
- Limited time for decision-making
- Requires a solid understanding of technical analysis
- Trades must be closed by 3:15 PM or are automatically squared off
- Emotional pressure and psychological stress
What is Short Selling in Intraday Trading?
Short selling in intraday trading is the practice of selling a stock without actually owning it, to buy it back later at a lower price. This allows traders to profit even when prices are falling.
Example:
Imagine you expect a stock priced at ₹500 to fall. You short-sell 100 shares at ₹500, and later buy them back at ₹470. Your profit is ₹30 per share, totalling ₹3,000 (excluding brokerage and taxes).
Remember, short selling must be squared off the same day during intraday trading.
Understanding Market Behaviour and Trends
Market behaviour is influenced by global news, economic data, investor sentiment, and sectoral performance. Price movement is never linear—it follows a zig-zag pattern of highs and lows.
Trend Basics
- Higher High, Higher Low = Uptrend
- Lower High, Lower Low = Downtrend
- Sideways Trend = Range-bound market
Understanding these patterns helps traders time their entry and exit points more effectively.
Rules for Choosing Stocks in Intraday Trading
Not every stock is suitable for intraday trading. Use these criteria for better performance:
- Choose liquid stocks with high trading volumes
- Target stocks with medium to high volatility
- Invest in correlated stocks from trending sectors
- Follow the broader market trend
- Avoid small-cap and penny stocks
- Focus on companies with transparency and good governance
How to Choose Intraday Stocks
Step 1: Stock Shortlisting
Start with a watchlist of 30–40 stocks. Analyse their chart patterns and filter out those with clear trends and breakout potential.
Step 2: Sectoral Analysis
Identify which sector is gaining momentum. Pick leading stocks within that sector.
Step 3: Look for MA Crossovers
Moving Average crossovers often indicate the start of a new trend.
Step 4: Find Breakout Stocks
Look for stocks breaking out from a resistance level or a technical pattern like a triangle.
Step 5: Use Simple Techniques
Check the top gainers and losers of the day. These often show high volatility and provide good trading opportunities.
Market Structure and Price Movement
The market structure is essential to intraday trading. Prices move in a series of highs and lows.
- Support: The price level at which demand is strong enough to stop the price from falling further.
- Resistance: The price level at which selling pressure prevents the price from rising.
- Trendline: A visual representation of price direction drawn using trendline tools.
Use these elements with volume indicators and moving averages to confirm patterns.
Candlestick Patterns Every Intraday Trader Must Know
Candlestick patterns are key indicators of market sentiment. Combine these with volume and trend analysis.
Bullish Patterns
- Hammer: Small body, long lower shadow—signals bullish reversal
- Bullish Engulfing: Large green candle fully engulfs previous red candle
- Piercing Line: A green candle opens lower and closes above the midpoint of the previous red candle
Bearish Patterns
- Inverted Hammer: Small body, long upper shadow—caution in an uptrend
- Bearish Engulfing: Large red candle covers previous green candle
- Shooting Star: Small body, long upper shadow—signals bearish reversal
- Hanging Man: Appears after an uptrend, signals potential fall
Popular Chart Patterns for Intraday Trading
Recognising chart patterns can enhance your trading accuracy.
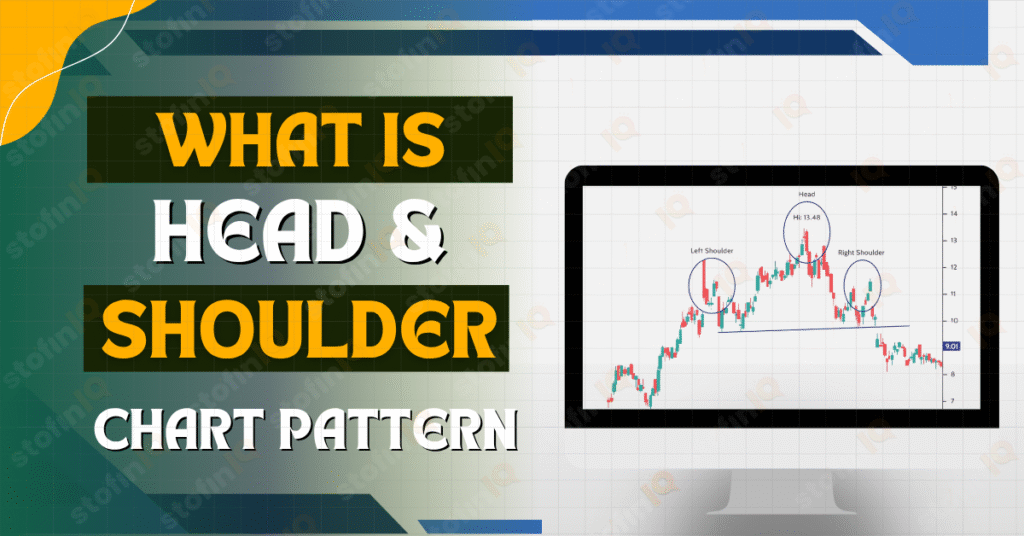
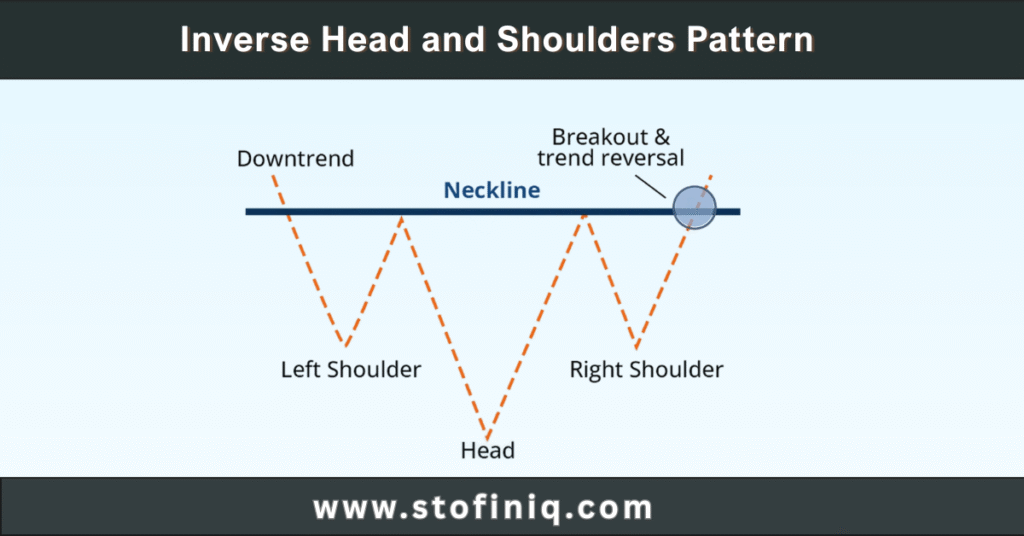
- Inverted Head and Shoulders: Signals a reversal from downtrend to uptrend
- Double Top: Two peaks at the same level—sign of bearish reversal
- Double Bottom: Two troughs at the same level—sign of bullish reversal
- Triangle Pattern: Suggests continuation or breakout, depending on volume
- Neckline: Used in head and shoulder patterns as a critical level for breakouts
Using Technical Indicators Relative Strength Index (RSI)
Indicates whether the market is overbought (RSI > 70) or oversold (RSI < 30).
Moving Averages
- Simple Moving Average (SMA) and Exponential Moving Average (EMA) help identify trends.
- Common choices: 9-day, 20-day, and 50-day EMAs
Use moving averages with candlestick and trendline tools for confirmation.
Tools and Software for Stock Selection

One of the most reliable platforms is Investing.com.
Features include:
- Technical stock screener
- Tools and options for filtering
- Candlestick pattern detection (use with volume and trendline, not alone)
- Timeframe customization
- Set reliability filters (minimum 3-star reliability)
Stop Loss: Risk Management for Intraday Traders
A stop loss is crucial to control potential losses in intraday trading.
Example:
Suppose you invest ₹10,000 and divide it across 3 trades (₹3,333 each). One stock suddenly falls, and the price drops below your comfort zone. A stop loss automatically exits the trade, minimising the loss.
Stop loss orders must be manually adjusted or cancelled to reflect changing conditions.
Risk-Reward Ratio: The Golden Rule
Set a risk-reward ratio for every trade.
- Minimum: 1:1
- Recommended: 1:2 or 1:3
A 1:3 ratio means you’re risking ₹100 to gain ₹300. This ensures that even if you’re right only 40% of the time, you remain profitable.
Conclusion
Intraday trading requires discipline, advanced technical analysis, and constant watching of your stocks. Understand the market structure, take note of chart patterns, recognise some stocks over others, and use discipline in risk management, and you will leverage intraday trading to yield a consistent profit. In the beginning, focus on trades with small amounts, learn from each transaction, and build up your level of confidence through experience. Trade based upon strategy and methodology, not trying to find, trade based on emotions.
And if you want to dive deeper into the world of trading, don’t forget to check out more blogs on StofinIQ. If you’re genuinely interested in learning about the stock market, investing, trading, or the technical and fundamental analysis of stocks, mutual funds, IPOS, or anything related to making money from the market, subscribe to our channel. Just subscribe to our channel, Neeraj Joshi , and watch free, well-researched videos on the stock market, finance, investing, trading, and much more. Swing Trading for Beginners is just the beginning — once you get the hang of it, the market becomes a playground of possibilities.
I left my engineering job to follow my true passion writing and research. A passionate explorer of words and knowledge, I find joy in diving deep into topics and turning rich, insightful research into compelling, impactful content. Whether it’s storytelling, technical writing, or brand narratives, I believe that the right words can make a real difference.