What are chart patterns?
A Chart pattern is a pattern within a chart. It is formed when prices are graphed. Chart patterns are used in trading in stock or commodity markets. Studying chart patterns is important because they play a large role in technical analysis. When data is plotted, there is usually a pattern which naturally occurs and repeats over a period.
Key Takeaways
Definition
The inverse head and shoulders is a bullish reversal chart pattern that typically forms after a downtrend and suggests a trend change to up.
Structure is Important
It includes three dips: the left shoulder, a deeper head, and a higher right shoulder, connected by a neckline going through the highs in between the dips.
Volume Matters
High volume on a breakout through the neckline confirms the pattern’s validity with less chance of a false move.
Use on Higher Timeframes
The patterns hold more accuracy on a daily or weekly chart but can be used during intraday if confirmation is strict.
Entry & Stop-loss Plan
Once the neckline is broken to the upside, that would be the entry, and place a stop-loss below the right shoulder for better risk management.
Indicator assistance should improve your accuracy.
Using indicators such as RSI (with divergence), MACD crossover, and moving average can help to provide confirmation and improve timing.
Importance of technical analysis in trading decisions
Technical analysis helps traders understand the market trends and make better entry and exit decisions by studying past price movements.
It is important because:
- Identifies trends and patterns
- Helps in setting stop-loss and target levels
- Useful for short-term trading
- Reduces emotional decision-making
- Aids in timing the market effectively
Overview of trend reversal patterns
The trend reversal patterns are a sign that there could be a shift in the direction of the market, either an uptrend to a downtrend or vice versa. These trends enable the traders to identify points of turning and make the necessary strategy adjustments.
Popular Reversal Factors:
Head and Shoulders: Indicates that a pending opportunity to trade is in an uptrend, but it has to go down.
Inverse Head and Shoulders: Shows that the downtrend is going to be changed to an uptrend.
Double Top and Double Bottom: A double top is considered indicative of a bearish reversal; a double bottom is considered indicative of a bullish reversal.
Rounding Bottom: A slow turnaround in a downtrend into an uptrend.
Falling and Rising Wedge: A falling wedge is a bullish indication, and a rising one is bearish.
They become more reliable once checked by volume and other technical indicators.
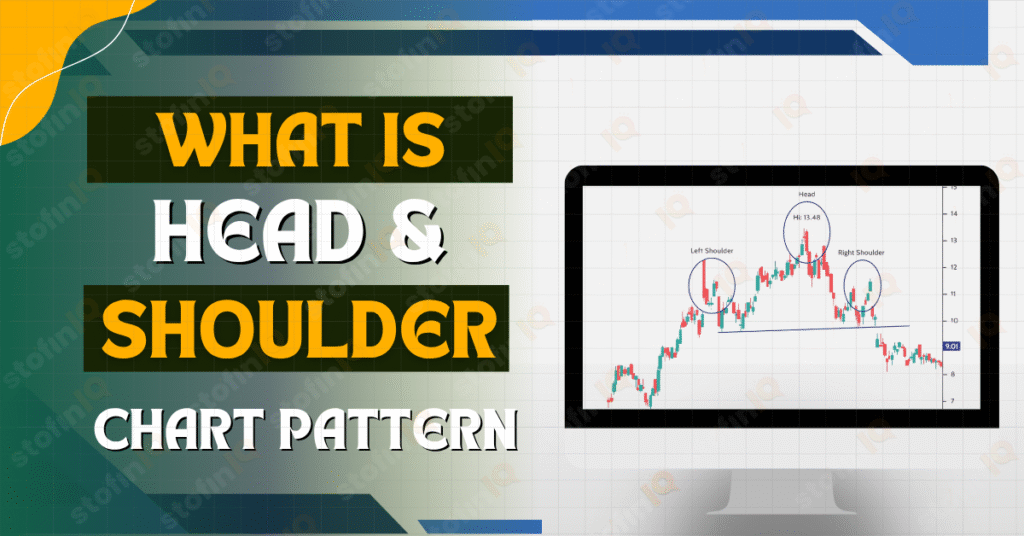
What is the Inverse Head and Shoulders Pattern?
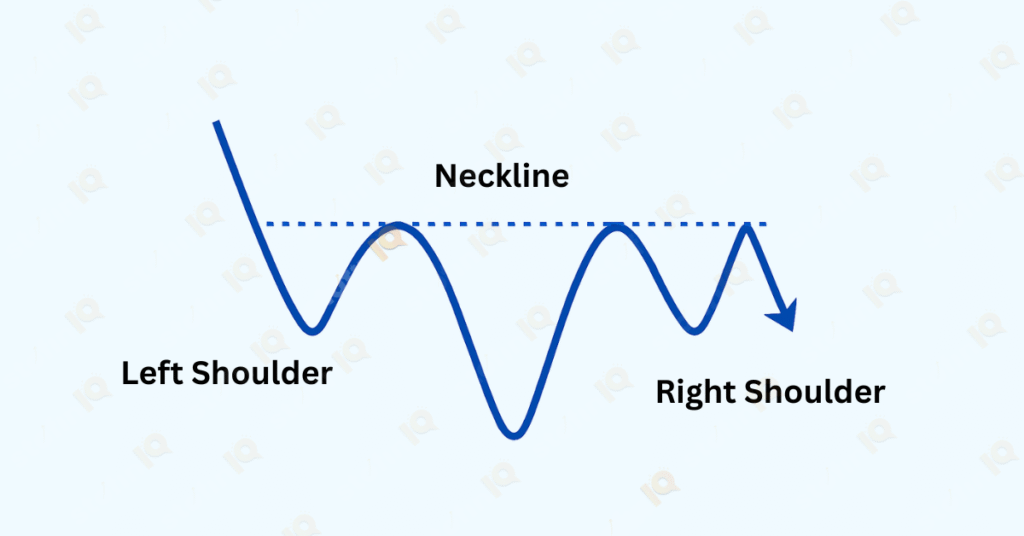
The inverse head and shoulders chart pattern is a chart pattern that signals a possible change in a downtrend to an uptrend. The pattern looks as if a person’s shoulder and head were flipped upside down.
There are three parts of the inverse head and shoulder pattern:
- A low (the left shoulder)
- A deeper low (head)
- Higher low (the right shoulder)
When the price breaks above the “neck” line (the neckline is a line that connects the highs between the lows), it usually means that the market might be going up now. Traders see this as a buying opportunity.
Difference between the standard Head and Shoulders pattern and the inverse Head and Shoulders
The head and shoulders and inverse head patterns are the opposite of each other.
One suggests the end of an uptrend, and the other suggests that there could be a possible reversal from a downtrend. Understanding their key differences helps the traders to decide whether to buy or to sell.
| Feature | Head and Shoulders | Inverse Head and Shoulders |
| Trend Direction | Uptrend to Downtrend | Downtrend to Uptrend |
| Shape | Peak—Higher Peak—Lower Peak | Dip—Lower Dip—Higher Dip |
| Indicates | Selling Opportunity | Buying Opportunity |
| Neckline Break Result | Price likely falls | Price likely rises |
| Trader Action | Look to sell or short | Look to buy or go long |
The head and shoulders and inverse head patterns are the opposite of each other.
One suggests the end of an uptrend, and the other indicates that there could be a possible reversal from a downtrend. Understanding their key differences helps the traders to decide whether to buy or to sell.
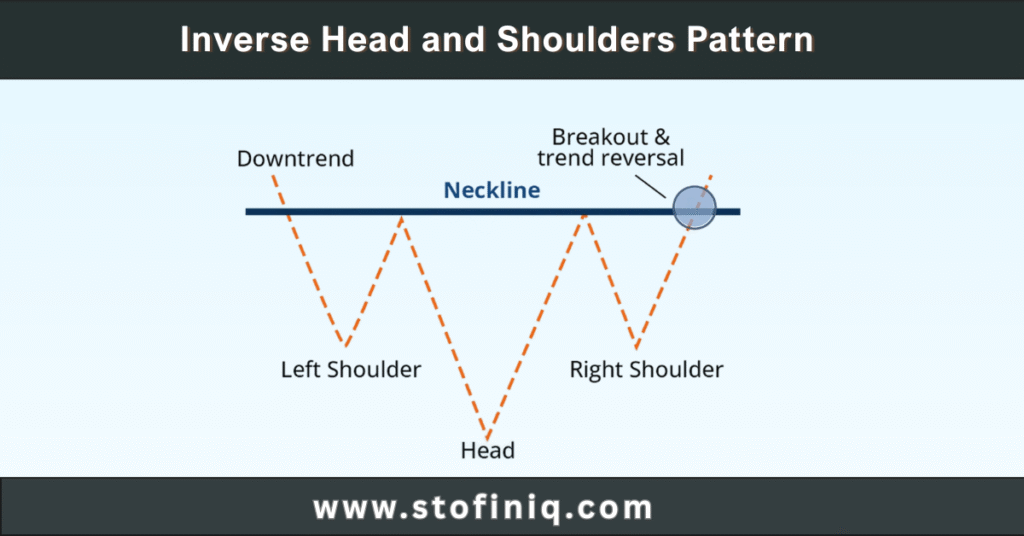
Visual Anatomy of the Inverse Head and Shoulders
Breakdown of the Inverse Head and Shoulders Pattern:
- Left Shoulder: The price drops and then rises slightly.
- Head: The price falls lower than the left shoulder and rises again.
- Right Shoulder: The price drops again, but not as low as the head, then begins to rise.
- Neckline: A line drawn across the highs between the shoulders and the head; when the price breaks above this, it confirms the reversal.
As shown in the diagram, the inverse head and shoulders pattern has three dips: the left shoulder, a deeper head, and the right shoulder. The neckline connects the highs between them. A breakout above the neckline signals a likely shift from downtrend to uptrend.
How symmetry matters in pattern recognition
Symmetry adds reliability to chart patterns. In an inverse head and shoulders, when there is symmetry in a chart pattern, it makes the pattern stronger. Symmetry means that both shoulders are similar in height, width, and distance from the head. Having symmetry means that the market is more stable and there are chances of a successful breakout after the neckline is crossed. Though perfect symmetry is rare, traders do consider symmetrical patterns as more trustworthy
Psychology Behind the Pattern
Market sentiment at each stage of the pattern
Left Shoulder: Sellers push the price down, but buyers step in, and there is a minor recovery, which indicates early signs of demand.
Head: Bears regain control and lower the price. However, buyers show a stronger presence this time, which creates a lower low.
Right Shoulder: Sellers try again, but they do not create a new low, which confirms that the bearish pressure is weakening.
Neckline Break: Confidence turns, allowing buyers to regain control; a breakout confirms a bullish reversal, which attracts more buyers.
Entry Points and Confirmation
Breakout Through the Neckline:
The best entry position for this setup is once the price breaks through the neckline after the right shoulder. This is a breakout that suggests the possibility of reversal and an entry opportunity to create a long position.
Volume Confirmation Signals:
In the event there is volume that expands on the breakout, this provides even more strength behind the signal. Increased volume suggests increased participation in the trade, which also stops buyers from stacking their trades behind the move.
Ideal Candlestick Patterns for Entry:
Check for bullish candlestick patterns near the neckline, such as a bullish engulfing, before a morning star or a strong green candle. This provides extra confirmation and a safer entry.
Price Target and Stop-Loss Placement
Identifying the Distance From Head to Neckline:
First, measure the vertical distance from the lowest portion of the head to the neckline of the head and shoulders pattern.
Projecting the Target from the Breakout:
Add that distance to the breakout point above the neckline. This then gives a rough target price level where the next possible level of resistance may occur.
Placing a stop-loss order to mitigate risk:
Place the stop-loss order just below the right shoulder. This will enable you to mitigate your risk if the breakout fails and the pattern does not develop as anticipated.
Timeframe Applicability
Does this pattern work on intraday charts?
Yes, the inverse head and shoulders pattern can form on intraday charts like 5, 15, or 60 minutes. However, with a smaller time frame, there are often more false signals; therefore, I think confirming volume & the breakout are much more important.
How reliable is it on daily, weekly, and monthly timeframes?
The pattern is much more reliable on daily, weekly, or monthly charts. On longer timeframes, the market noise is reduced, which is the case with all patterns, and therefore, increases the strength & success rate of the breakout.
Inverse Head and Shoulders in Bullish Reversals
When It Typically Forms:
This pattern generally forms after a long downtrend, when selling pressures are starting to lift and buyers are starting to step in.
Signals a Bottom in Downtrends:
It serves as a bullish reversal signal, signalling that a bearish phase is coming to an end and a potential uptrend can begin.
Historical Market Examples:
A famous example is the 2009 S&P 500 bottom, when an inverse head and shoulders formed before launching into a long bull market. The same or similar patterns formed in Bitcoin (2018) and Tesla stock (2019) before major rallies.
Volume Analysis and Its Importance
How Volume Confirms the Breakout:
A large increase in volume during the breakout of the neckline signals that substantial buying interest is supporting the breakout and making the pattern much more reliable.
What Low Volume Can Mean:
A breakout that occurs with low volume may be a false break or a weak breakout, as it shows no conviction from buyers.
Smart Money Movement and Pattern Reliability:
Volume expanding during a pattern, especially at the right shoulder and breakout level, often signals that smart money (institutional investors) is entering the trade, so the more volume there is, the more implication that the reversal was more reliable, and the chances of a sustained uptrend increase.
Common Mistakes to Avoid
Mistaking Normal Pullbacks for the Pattern:
Not every dip and rebound is an inverse head and shoulders pattern. Getting caught confusing random pullbacks as one can result in bad trades.
Failing to Use a Volume Confirmation:
A break without strong volume can fake you out. If you choose to skip the volume analysis, this will make the overall pattern less reliable.
Entering Too Early and Not Waiting for the Breakout:
Jumping in before the neckline is broken is riskier, as the price may fail or trade in the opposite direction depending on the strength of sellers/buyers. Wait for the confirmation!
How to Use the Pattern with Indicators
RSI Confirmation for Divergence:
When searching for bullish divergence between price and RSI at the head—when price makes a lower low while RSI makes a higher low—it is a good confirmation for a reversal signal.
Moving Averages for Trend Direction:
Use moving averages (commonly used moving averages are the 50-day and 200-day) to confirm the direction the trend is changing. When the price crosses above the MA or the neckline lands on the MA for support, it is a good confirmation of a potential pattern.
MACD crossover signals:
A bullish MACD crossover (MACD line crossing above the signal line) in the right shoulder of the inverse Head and Shoulders or during a breakout can help confirm momentum and provide a confirmation of entry signal.
To know more about technical indicators, you can check out this article: Technical Indicators Explained: Building Better Trading Strategies
Backtesting the Pattern for Better Accuracy
Tools to Use for Backtesting:
Platforms like TradingView, MetaTrader, and Thinkorswim allow traders to manually or automatically backtest the inverse head and shoulders pattern using historical price data.
Example Results and Win Rates:
Backtests on daily charts often show win rates between 60% and 70% when confirmed with volume and indicators. Success improves when paired with proper stop-loss and target strategies. However, results vary by market, timeframe, and setup quality.
(FAQs)
The inverse head and shoulders pattern means a potential trend reversal, a bullish pattern. This pattern shows that a trend higher is coming to an end and starting a trend lower.
It is pretty reliable, especially on higher timeframes and with volume confirmation.
You can, it’s less reliable on lower time frames, and it requires quick decision-making.
You should look for volume to be high during the breakout, as well as confirmation from indicators such as RSI or MACD.
I would say daily charts and weekly charts have the better accuracy, but intraday can be used with caution.
Yes, you should wait for a retest of the neckline; it will be an easier and safer entry with less risk.
You could put it just below the right shoulder.
Yes, volume is required for confirmation; volume ramping up with the breakout offers credibility to the breakout, leaving less room for failure.
I left my engineering job to follow my true passion writing and research. A passionate explorer of words and knowledge, I find joy in diving deep into topics and turning rich, insightful research into compelling, impactful content. Whether it’s storytelling, technical writing, or brand narratives, I believe that the right words can make a real difference.

Just wanna comment that you have a very decent website , I love the design and style it really stands out.
I admire your piece of work, regards for all the interesting content.
I am glad to be a visitor of this everlasting blog! , appreciate it for this rare info ! .
Thankyou for this wonderful post, I am glad I noticed this website on yahoo.
Hi there, You have performed an excellent job. I will definitely digg it and in my opinion suggest to my friends. I am sure they will be benefited from this website.
I believe other website owners should take this site as an model, very clean and superb user genial style and design.