In the stock market, there are patterns that reveal more than just price action. The head and shoulders formation is one such pattern—minimal but very important. It tends to mark a reversal, suggesting what formerly rose confidently might now start to descend. Traders keep an eye on it, not merely because of its shape, but because of the change in sentiment it silently betrays.
Key Takeaways
- Head and shoulders is a chart pattern, and it has three peaks—two short ones on the sides (shoulders) and a taller one in the middle (head)
- It shows that an uptrend may be ending, and prices could start falling
- The neckline is a key support line; when the price breaks below it, the pattern is confirmed
- Volume mostly decreases during the pattern and rises sharply during the breakout
- The inverse version of this pattern indicates a possible bullish reversal
What is the head and shoulders chart pattern?
Head and shoulders is a price chart that looks like a human figure, with two shoulders and a head in the middle.
The pattern consists of three peaks:
two shorter shoulders on the sides and a taller head in the middle. The middle one is the tallest, and the two on the sides (the shoulders) are shorter and nearly equal.
Significance of Head and Shoulders in Technical Analysis
This pattern shows that the price was rising, then it reached a peak; here it tried to rise again, but it could not go higher, and after that it started to fall. This usually means the end of an uptrend. Traders see it as a warning that prices might go down soon. (The uptrend might be ending.)
Quick overview of bullish vs bearish reversal patterns
Reversal patterns signal that a trend is about to change direction.
- Bullish Reversal: Downtrend turning into an uptrend
- Bearish Reversal: Uptrend turning into a downtrend
Here are some commonly observed reversal patterns
| Bullish Reversal | Bearish Reversal |
| Inverse Head & Shoulders | Head & Shoulders |
| Double Bottom | Double Top |
| Morning Star | Evening Star |
| Bullish Engulfing | Bearish Engulfing |
| Hammer | Shooting Star |
| Falling Wedge | Rising Wedge |
- Bullish patterns appear after a downtrend and hint at buying opportunities.
- Bearish patterns appear after an uptrend and hint at selling or shorting opportunities.
Technical Analysis 101: Foundation for Pattern Trading
What is technical analysis?
Technical analysis is a process by which traders analyse charts based on data and analyse the market situation. They look at trading activity, price movements, and volume.
Technical analysis is different from financial analysis. To learn more about their differences, you can check out this blog. Fundamental Analysis vs. Technical Analysis: Which Strategy Wins?
Role of chart patterns in trading
Chart patterns are very important in trading because they represent the price movements visually, which makes identifying potential trends, reversals, and breakouts easier.

Types of price patterns: continuation vs reversals
Price patterns in technical analysis are illustrated forms on charts of everything from simple price changes to complicated price changes, where traders can speculate will occur in price. Price patterns can be classified into two forms:
- Continuation Patterns:
These patterns indicate that the current trend is likely to continue in the same direction after a brief pause or consolidation. They suggest that the market is taking a “breath” before resuming its prior trajectory.
- Reversal Patterns:
These patterns signal that the current trend is likely to change direction. They indicate a shift in market sentiment, suggesting that an uptrend might be ending and a downtrend beginning, or vice versa.
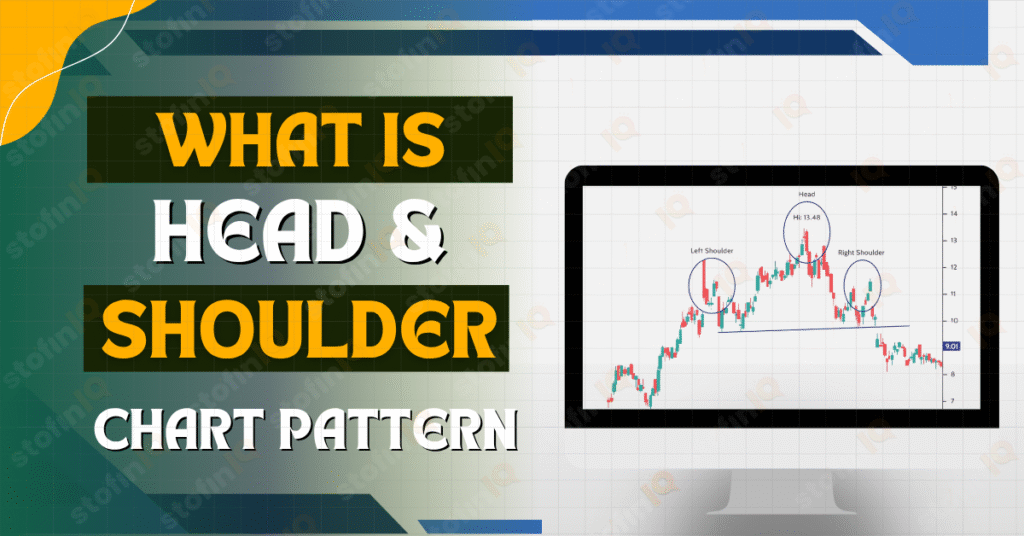
Structure of a Head and shoulder pattern
Components of the head and shoulder pattern
The head and shoulders pattern consists of several key components that form its distinctive shape and signify its bearish reversal potential:
Left Shoulder: Initial price peak during an uptrend, followed by a slight dip.
Head: Higher peak than the left shoulder, followed by a more significant decline.
Right Shoulder: The peak is lower than the head but similar to the left shoulder, indicating weakening buying pressure.
Neckline: A support line connecting the lows between the shoulders and head; a break below it confirms the pattern.
Volume: Usually highest at the left shoulder, decreasing at the head and right shoulder, and increasing when the neckline is broken.
Ideal shape and symmetry for the Head and shoulder pattern
While a perfectly symmetrical head and shoulders pattern is ideal, minor variations are common. The key is that the overall shape clearly shows the three peaks and a discernible neckline.
These are the points to look for when identifying the ideal shape of the head and shoulder pattern.
- The left and right shoulders should be significantly lower than the head.
- The neckline can be upward sloping, downward sloping, or flat.
- A clear break below the neckline is crucial for pattern confirmation.
Visual representation of the head and shoulder pattern

As you can see in the figure above, the head and shoulders pattern has three different peaks:
- The left shoulder forms first as the price goes up and then dips.
- Then comes the head, a higher peak; after this, there is another dip
- Finally, the right shoulder forms, roughly equal in height to the left one.
- The neckline connects the two lowest points of the dips and acts as a support line.
Once the price breaks below the neckline after forming the right shoulder, it signals a trend reversal from bullish to bearish.
Types of head and shoulder patterns
Traditional (Bearish Reversal) Head and Shoulders
This is the most common head-and-shoulders pattern. It means that an uptrend (prices going up) is about to end, and prices will start going down.
Here’s how it forms:
Left Shoulder: There is a sharp rise in the price followed by a slight fall in price.
Head: This price becomes even higher than the left shoulder, and the next move is even more substantial.
Right Shoulder: The price is back in; however, not to the same degree as the head (on many occasions, to the same height as the left shoulder).
Neckline Break: What is most significant is the occurrence of price breaking through the barrier of the so-called neckline (imaginary line between low points following the left shoulder and head). This break validates the fact that the price will go down even further.
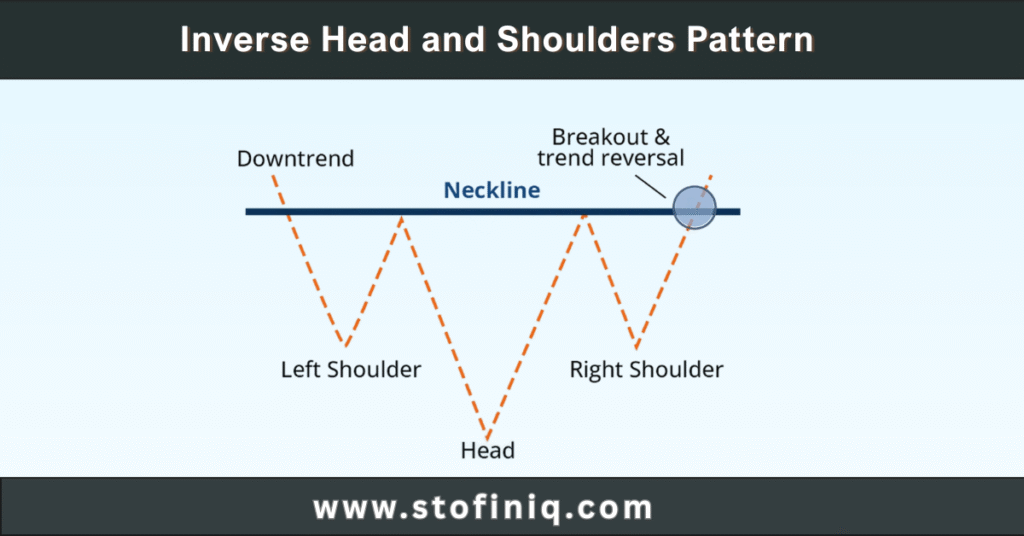
Inverse (bullish reversal) Head and Shoulders
The inverse Head and Shoulders is the opposite of the traditional Head and Shoulders. It means that a downtrend (prices going down) is about to end, and prices will start going up. It looks like an upside-down human figure.
Here’s how it forms:
Left Shoulder: The price is dumped; a little later, it increases.
Head: The price falls lower below the left shoulder, after which it increases with much severity.
Right Shoulder: The price falls again, perhaps not so much lower than the head (and at least as shallow as the left shoulder).
Neckline Break: This is the very key when the price breaks up and continues to advance beyond the so-called neckline (a line to be drawn between the apices after the left shoulder and the head). The breakdown ensures that the price will increase even higher.
Horizontal Vs sloped necklines
The neckline may vary in a head and shoulders pattern, being horizontal, up-sloping, or down-sloping. A vertical neckline, although the easiest, is also trendy and does not ruin a valid pattern, though. The point is that the price has to repeat the neckline below (in case of a normal H&S pattern) or above (in case of an inverted H&S formation) in an impressive way in order to prove the trend reversal.
How does the Head and Shoulders pattern work
The head and shoulders have given the image of a fight between the buyers and the sellers. The first is buyer domination that pushes the prices towards the left shoulder. They extend further to the head; however, then, the fall is greater, which means seller resistance. The weaker try to form the right shoulder, indicating buyers who are exhausted.
The neckline break is the most crucial point when the prices are breaking the crucial support stage, and that is evidence that the sellers have gained the land and are likely to fall downwards. It is the psychological tendency that reverses the optimism into a lack of confidence and the chance to sell to as many people as possible.
Advantages and disadvantages of the Head and Shoulders pattern
Like all technical analysis tools, the head and shoulders pattern has strengths and weaknesses. Understanding these helps traders use them effectively and manage expectations. This section covers its key advantages and disadvantages.

Trading the Head and Shoulders: Entry Strategies
Entry upon the neckline breakout
This is considered to be the safest strategy.
- Wait for the Break: After the right shoulder, wait for the price to close clearly below the neckline on a significant candlestick.
- Enter the Trade: Once the price confirms below the neckline, enter a short (sell) trade.
Why it’s used: This strategy confirms the reversal, reducing fakeouts.
Example: If the neckline is at ₹50, you’d wait until the price closes below ₹50 (e.g., at ₹49.50) before selling.
Retest strategy for confirmation
This strategy involves waiting for the price to break the neckline and then retrace back to the neckline before continuing in the reversal direction.
- Wait for Retest:
After the neckline break, wait for the price to move back up to touch or come very close to the neckline (which now acts as resistance).
- Enter the Trade:
Enter a short (sell) trade as the price bounces off the neckline and starts to fall again.
Why it’s used: This strategy offers a potentially better entry price and further confirmation that the neckline is indeed acting as resistance.
Example: If the neckline is at ₹50, the price drops to ₹48, then goes back up to ₹49.80 (retesting the neckline), and then starts to fall again, you would sell at this point.
Using candlestick signals to strengthen entry
To make your entry more powerful when you are going into a Head and Shoulders trade, you should seek the occurrence of bearish candlestick patterns on the neckline (most ideally during a retest). Examples:
Bearish Engulfing: A large bear candle engulfs the earlier bullish candle; there is high selling pressure.
Shooting Star/Inverted Hammer: It has a little body and a long upper wick, which indicates a higher price refusal.
Dark Cloud Cover: A bearish candle opens above the close price of a previous candle that was bullish but closes way inside the body of the previous candle, signalling that momentum has reversed.
Such patterns serve as further confirmation that the neckline acts as support and the price is expected to make a further decline.
Comparison with Other Reversal Patterns
Head and Shoulders vs Double Top
Both the Head and Shoulders and the Double Top patterns are giant bearish reversal patterns, which signal that there might be a change in an uptrend moving to a downtrend. Even though they are both market top indicators, they are different in information and structure.

Head and Shoulders vs Triple Top
Head and Shoulders, as well as the Triple Top, are two such patterns that are bearish reversal tests and are used to determine that an uptrend may be coming to its end. The two may show that buyers are losing control; however, they vary in the way in which they are constructed and the number of substantial peaks.
Here are the key differences between them:
| Feature | Head and Shoulders | Triple Top |
|---|---|---|
| Number of Peaks | Three (left shoulder, head, right shoulder) | Three (three distinct high points) |
| Peak Heights | Head is the highest; shoulders are lower and similar | All three peaks are roughly equal in height |
| Structure | Resembles a human head with two shoulders | Resembles three “M”s or three peaks at the same resistance level |
| Neckline | Connects the lows between the shoulders and the head | Connects the low points (valleys) between the three peaks |
| Volume | Typically decreases as the pattern forms, increasing on the neckline break | Often decreases with each subsequent peak, increasing on the neckline break |
| Market Psychology | Gradual loss of bullish momentum, increasing bearish pressure | Repeated failure to break a significant resistance level three times |
| Confirmation | Break below the neckline | Break below the support level (valley between peaks) |
When to prioritise H&S over others
Prioritise the head and shoulders pattern when you see a clear, well-formed pattern with a distinct head and shoulders, especially if it appears after a strong uptrend. Its reliability as a bearish reversal signal, coupled with measurable price targets and clear entry/exit points, makes it a powerful tool for anticipating significant market shifts, often offering more definitive signals than patterns like Double or Triple Tops.
Indicators to Use with Head and Shoulders
RSI for momentum shifts
The RSI, a momentum indicator, confirms the Head and Shoulders pattern by showing divergence. When price makes a higher high (head) but RSI makes a lower high, or a lower high on the right shoulder matches a lower RSI high, it signals weakening bullish momentum and a likely reversal.
MACD for divergence confirmation
The MACD (Moving Average Convergence Divergence) indicator confirms a Head and Shoulders pattern through bearish divergence. This occurs when the price makes a higher high, but the MACD forms a lower high, indicating weakening bullish momentum.
Moving averages for trend validation
Moving Averages (MAs) can validate a Head and Shoulders pattern by confirming the underlying trend. As the price moves below key moving averages (e.g., 50-period or 200-period MA) after breaking the neckline, it provides further confirmation of the bearish reversal and strengthening downtrend.
Inverse head and shoulder strategy
Structure and logic behind the bullish reversal pattern
The inverse head and shoulder follows the following structure.
- Upside-down Left Shoulder: Price dips, then rises.
- Upside-down Head: Price dips lower, then rises more.
- Upside-down Right Shoulder: Price dips again, but not as low as the head.
- Neckline: A line connecting the highs between these dips.
This shows sellers are weakening as prices stop making new lows, and buyers are taking over. A strong move above the neckline confirms the uptrend.
How to trade using the same principles
Trading Inverse Head and Shoulders uses the same principles as the traditional pattern to identify bullish reversals. Entry strategies include buying upon a neckline breakout or after a retest of the neckline, often reinforced by bullish candlestick signals like engulfing patterns or hammers.
Unique volume consideration for bullish setups
Normally, the heaviest volume for a bullish Inverse Head and Shoulders occurs when the price is forming the upside-down left shoulder. It generally decreases during the upside-down head and upside-down right shoulder as the selling pressure loses steam. A significant spike in volume is expected when the price breaks above the neckline, confirming the bullish reversal and buying interest re-engages.
Common mistakes traders make
Jumping in before confirmation
Don’t buy or sell until the pattern is finished and the price breaks the neckline. Waiting for confirmation helps avoid losing money on false signals.
Ignoring volume behaviour
Always check the trading volume. If the price breaks a key level but volume is low, it might be a false signal (a “fakeout”).
Misidentifying regular consolidation as H&S
The market sometimes just takes a break. Don’t mistake these short pauses for a Head and Shoulders pattern, which signals a trend change.
Head and shoulders in a bear vs. a bull market
- Pattern reliability in bearish trends:
In a downward market, the Head and Shoulders pattern is more reliable, as selling is already strong.
- Strength of inverse patterns in early bull runs:
The Inverse Head and Shoulders pattern is very strong at the start of an upward market, showing buyers taking over.
- How broader market sentiment affects outcomes:
Overall market feeling changes how well the pattern works. In a strong bull market, a bearish pattern might lead to a small drop, and in a strong bear market, an Inverse pattern might lead to a weak rise.
FAQ
Bearish reversal.
Yes, across different assets.
You can, but at shorter time intervals, there are more, on average, false signals.
It is a speedy reversal of the price after the price breaches the neckline and with low volume.
Shift from bullish to bearish control.
Head and Shoulders has three peaks, whereas Double Top has two.
No, it’s bearish; inverse head and shoulders is bullish.
Varies from hours (intraday) to months (daily/weekly).
Yes, with practice and risk management.
Reference:
I left my engineering job to follow my true passion writing and research. A passionate explorer of words and knowledge, I find joy in diving deep into topics and turning rich, insightful research into compelling, impactful content. Whether it’s storytelling, technical writing, or brand narratives, I believe that the right words can make a real difference.