Candlestick patterns tend to be the silent market indicators, which indicate the market mood. One of them is the Shooting Star candlestick pattern which is one of the important patterns sought by traders after a promising bullish run. It can be minor on the chart, but it’s like it can have a very big message, a change of momentum. Just like this, another subtle yet powerful formation is the Doji candlestick pattern, which reflects deep market indecision and can often mark key turning points in price action.
The Shooting Star pattern is not a pattern that shouts at people but has a story to narrate in its structure. It implies that someone was driving the price in the session up but as it approached the end, buyers had been replaced by sellers and pushed the price back down. This projection at elevated levels usually acts as a pointer to the possible loss of power in the bullish trend.
This blog will take you through what the Shooting Star pattern is, its meaning, and how traders utilize it to predict reversals. Regardless of whether you are starting to learn about the world of trading or refamiliarizing yourself with the patterns of charts, getting acquainted with this formation may allow you to make wiser and more intuitive choices when trading.
Key Takeaways
- The Shooting Star is a bearish reversal formation that occurs mostly when the price is moving up; thus, it creates a possibility of buying weakness.
- It is characterized by a small, actual body close to the low of the candle, a long upper shadow and a small or even non-existent lower shadow, thus indicating price denial at higher prices.
- The confirmation is important- it is better to wait till the appearance of the bearish candle after the Shooting Star to enter the trade and limit false alarms.
- To trade short, enter the stop below the trend of the pattern; high above the pattern is used as a stop-loss strategy to effectively manage the risk.
- Add to your configuration the indications as RSI, MACD, or volume analysis and, of course, consider the general situation in the market to have more correct guesses.
What is a shooting star Candlestick pattern?
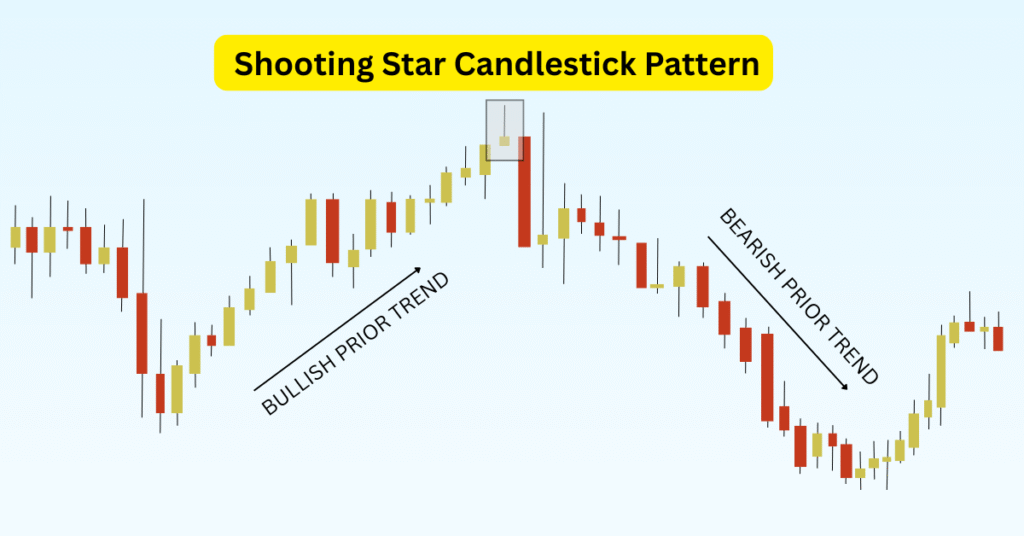
The Shooting Star is a bearish candlestick pattern and it normally occurs at the end of the uptrend and it should alert on a possible price reversal. It is distinguished by a small real body around the low of the candle and a long upper shadow suggesting that the price opened and made a strong move up, but then it started falling and the end of the day price was close enough to the open price.
The trend indicates high selling pressure following some purchasing pressure which had pushed up the price in the first place hence hinting that the bullish mania could be on the decline. However, it does not necessarily foretell a reversal, but in most cases, traders consider the Shooting Star a signal that the bullish trend might be slowing down, particularly when it is called by a subsequent red candle or other technical patterns.
Definition: A Shooting Star is a bearish candlestick formation used following an uptrend, and its characteristics include a short body at the lowest end and a tall third which is the wick on top. It is an indication that buyers have lost their grip and selling pressure can result in a price reversal.
Psychology Behind the Shooting Star
The Shooting Star is one of the stories based on indecision and power shift. The formation of this candle indicates that the day has begun with good buying, that is, the prices were rising rapidly and that the “buying pressure” was to be seen ahead. However, things changed. Sellers came in pushing the price back down at the end of the session. Accordingly, although the price got high, it could not be sustained. This indicates that consumers are weakening and conversions are beginning to dominate.
To traders, it is an indication of a reversal of trend – the market may no longer be on a rising trend and may be soon on a falling trend.
How to Identify a Shooting Star Pattern
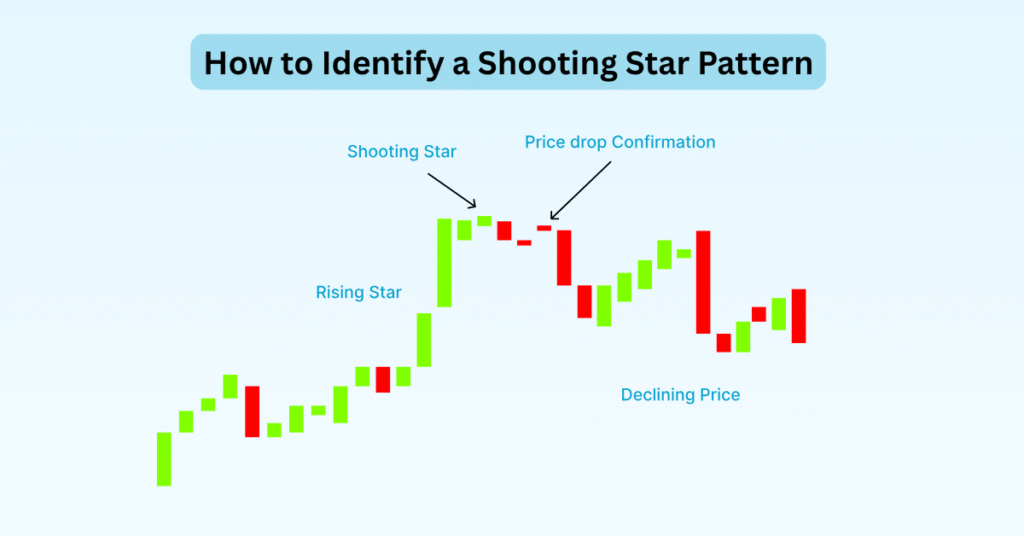
The common identification of Shooting Stars on a candlestick chart is relatively easy once you get to know what to detect. The shape of the candle is not only important as it must also be in the right place and with the correct story: market behaviour. This is what it can be identified as:
- It follows a Bullish trend: The Shooting Star can be of importance only when it appears following a powerful price increase. It is an indication that the trend may be reversing.
- Small real body near bottom: The candle also possessed a small body indicating that the open price and the close price were near each other. The location of this body comes close to the lower one of the candle range.
- Long upper shadow: The upper wick needs to be two times as much as the actual body. This shows that buyers made moves to increase the price but were not able to sustain it.
- No or little lower shadow: An actual shooting star has a very tiny or no lower wick whatsoever indicating that the closing price was close to the low of the day.
- Less importance is given to colour: although a red candle is added to the bearish signal, the pattern still can be true with a red or green body.
How to Confirm a Shooting Star Pattern?
Although the Shooting Star suggests that some reversal might occur, traders will not use the strategy in isolation. In order to arrive at the pattern, search after the bearish candle that supports the pattern, preferably one with good volume and solid decline. This second candle makes it obvious that indeed sellers are getting breakthroughs and that market feeling is changing.
Others even use technical indicators such as the Relative Strength Index (RSI) or moving average to provoke the signal. To illustrate, when RSI indicates that the market is experiencing an overbought status, then the warning of Shooting Star gets even more critical. Shortly, the confirmation is provided by the next thing that took place: not only the figure of the candle but the behaviour of the market after it.
Limitations of the Shooting Star Candlestick Pattern
Traders tend to employ the shooting star candlestick pattern as a bearish reversal pattern, especially when markets are on an upwards rally. Although it can present some useful information, it does have a number of limitations to it which makes it unreliable when applied in isolation. Appreciation of these disadvantages is important in making the well-informed decision about a trade.
Key Limitations:
Answering Signals: Shooting star might be seen in the market noise and it might not be an actual reversal signal. Left without any verification of subsequent candles, it alone will result in trades being made too early or in the wrong direction.
Volume Neglected: The trend does not consider volume in trade, which is vital in authenticating any price change. It is not reliable that a shooting star is formed on low volume compared to the ones formed on high volume.
Historical Context: It can only have meaning when it follows a large advance. When it happens in a side or a downward trend market, its predictability is highly hampered.
No Price Target: The shooting star does not specify how low the price will drop but, it is meant to give the indication that bullish force may be losing strength.
Demands Confirmation: The shooting star requires traders to wait and get a bearish candle to prove the trend is reversing, and this can take a long and the margin of profits earned is lowered.
Subjectivity in Interpretation: The appearance of a shooting star is also subjective; the shape, size, and location of it may vary, and therefore, this signal is not quite congruent in its perception by traders.
Inverted Hammer vs Shooting star pattern
The shooting star is one of the bearish candlestick patterns that appear following an uptrend. It has a little actual body at the low of the day and long upper shadow, a sign that the bulls attempted to move the price upwards but were finally overwhelmed by the bears. This loss of momentum implies that the uptrend may be losing power, and a reversal is impending. Nevertheless, the traders may not make any decision until a bearish sign is supported by a bearish candle on the next day, since the pattern can also give too many false signals.
On the other hand, the inverted hammer follows a downward trend and indicates the likelihood of a bullish correction. Such as a shooting star, it only means to have a small real body and a long upper shadow, but in the context of a falling market, it comes to mean exactly the opposite. The long shadow indicates that buyers tried to correct the bearish trend, but they were not entirely successful through that trading session, although they had made some corrections. It is necessary to confirm this reversal with a powerful bullish candle that occurs after the inverted hammer because only then should we think about going long.
How to Trade a Shooting Star Pattern: Step-by-Step Guide
The shooting star is a powerful bearish reversal candlestick pattern, but successful trading with it requires more than just spotting the shape on a chart. You need confirmation, a clear entry plan, stop-loss placement, and a strategy for exiting the trade. Here’s how to trade it step by step:
Step 1: Identify the Pattern After an Uptrend
Shooting Star is a very potent bearish reversal candlestick pattern, but trading with it using the mere presence of the pattern on your chart is not doable. You require confirmation, an entry plan that is definite and a stop-loss position as well as an exit trade strategy. It is possible to trade it as follows:
Step 2: Locating the Type of Pattern Following an Uptrend
The Shooting Star pattern has to be preceded by an obvious price uptrend – days or a longer bullish stock run-up. It is important to consider this context. The pattern would not count when made in a sideways or a downward-trending market. First search for a candle that has a relatively small actual body at the bottom, a long upper wick, and minimal or no shadows at the bottom. The higher the shadow is, the longer the rejection signal; the stronger the rejection signal.
Step 3: Awaiting Confirmation
Do not go into a trade immediately after the shooting star is observed. It is not an entry signal by itself, but a warning. Wait until the next candle closes bearish in a candle known as a ‘confirmation candle’. This follow-up candle must be closed under the body of the Shooting Star to indicate that selling forces have risen and the markets are responding to the preceding indecisiveness.
Step 4: Entering the Trade
When you confirm, then position your entry point. Most traders prefer to go short a little below the low of the Shooting Star candle or below the close of the confirmation candle whichever seems more conservative. This practice will prevent giving out false signals and be sure that you are entering when sellers are in charge.
Step 5: Put a Stop-Loss
It must include risk management. Put your stop-loss a little above the high of the Shooting Star candle. Why? Since that high is the last point where buyers had strength on their mighty side, when filmed above that high for a second time, the bearish arrangement is probably non-violated. This reduces loss in your capital and limits your risk.
Step 6: Model a Target Price or Exit
Your profit target should be based on the use of support levels, previous swing lows, or Fibonacci levels. The general rule of thumb is that many traders would seek the reward-to-risk ratio of at least 1:2 or 1:3 i.e., when you risk 100 make 200 or 300. Others also drag their stop-loss to guarantee the gains when the price swings their way.
Step 7: Take Extra Confirmation by use of Indicators
Although price action is the core of it, you may also reinforce the decision by using technical indicators. In case the Relative Strength Index (RSI) estimates an overbought state or the MACD begins crossing bearish, it confirms the bearish indication. You may also consider volume a Shooting Star with a large amount of volume can be considered an influential pointer.
Bonus Tip: Train Before Trading Live Money
Trading the Shooting Star pattern like any other strategy involves practice. Place it on a paper trading account or test it on past charts before trading with real capital. the more you know how this pattern reacts to various conditions in the market, the more comfortable you are going to be trading it.
The Shooting Star candlestick pattern may be much more than an eye-pleasing pattern on a chart, it can be rather described as a mindset change of the market, where buyers are replaced by sellers. With reasonable application and affirmed with correct tools and agency, it can form a desirable indication of your trading strategy. It is vital to recollect that no pattern operates separately. Never separate risk management and the market situation with technical vision.
Well done on completing the blog!
Hope this was informative and you decided to read more on the share market, share trade strategies, mutual funds and all that concern with personal finance, do remember to follow StofinIQ on a regular basis to get regular updates, tips and information.
Reference
I left my engineering job to follow my true passion writing and research. A passionate explorer of words and knowledge, I find joy in diving deep into topics and turning rich, insightful research into compelling, impactful content. Whether it’s storytelling, technical writing, or brand narratives, I believe that the right words can make a real difference.