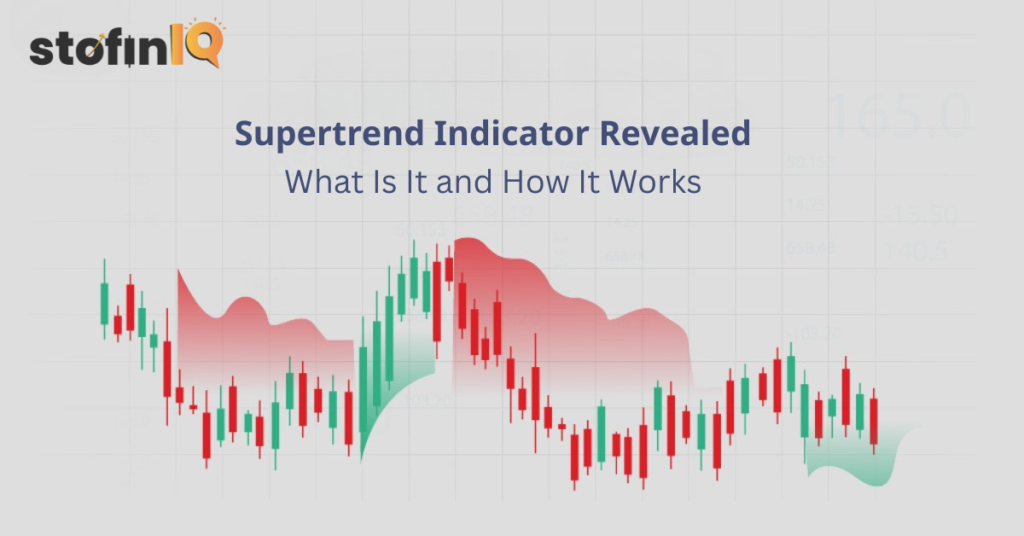
What is The Supertrend Indicator?
The Supertrend indicator first came out in 2009 because the trading world had grown too complex and needed to find a way to communicate better with it.
The French trader and author Olivier Seban developed the Supertrend indicator. When markets were filling up with too many indicators that obscured rather than illuminated Supertrend presented itself as a minimalist solution: clean, visual, amazingly effective. It is not just another label on a chart; it is a gadget that simplifies the noise of the market activity into one and only line of different colours that talks straight to the traders, either to remain, exit or await a transition.
When markets were filling up with too many indicators that obscured rather than illuminated Supertrend presented itself as a minimalist solution: clean, visual, and amazingly effective. It is not just another label on a chart, it is a gadget that simplifies the noise of the market activity into one and only line of different colours that talks straight to the traders, either to remain, exit, or await a transition.
Understanding the Supertrend Indicator
The Supertrend trades on price action and real-time volatility which has been translated into Average True Range (ATR) hence it reacts naturally to market conditions and flexibly changes itself accordingly instead of being governed by preset rules. The instrument has today become a favourite tool of both retail traders and even algorithmic trading systems that place a premium on both reaction time and accuracy. Visual simplicity covers up a key principle that every intelligent trader will agree with trend is your friend when you know when it changes.
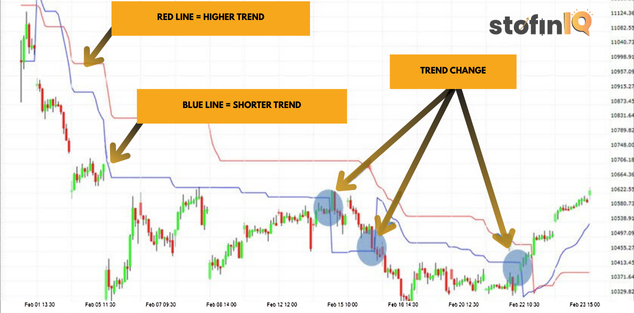
For example, if the price is above the Supertrend line, it indicates a bullish trend. Conversely, if the price is below the line, it signals a bearish trend.
Key Takeaways
Clearly shows bullish or bearish trends using colour-coded lines.
- Built on ATR: Uses Average True Range to adjust dynamically to market volatility.
- Simple Entry/Exit Signals: Buy when the price crosses above; sell when it drops below.
- Effective in Trending Markets: Works best during strong upward or downward trends.
- Can Act as Trailing Stop Loss: Helps lock in profits by trailing the stop with the trend.
How does the supertrend indicator work?
Supertrend indicator works on the wave principle and it uses the Average true range (ATR) and a multiplier to find the position of the Supertrend line.
Calculation of supertrend indicator
The calculation of the supertrend indicator involves three steps.
- Calculating the ATR (average true range)
- Determination of the supertrends Bands (Upper and lower bands)
- Plotting the Supertrend Line.
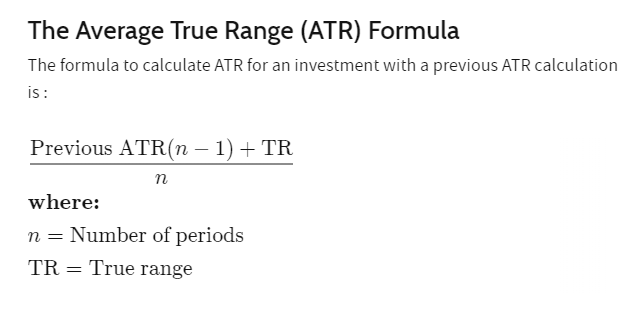
- Calculation of the ATR, What is ATR?
The ATR stands for the average true range. The ATR shows the volatility of an asset.
The ATR is typically taken from an average of 14 days it shows the average range price swing for an investment over a specified period.
2. Determination of the supertrends Bands (Upper and lower bands)
Now two bands are generated generate two bands, an upper and a lower band, which act as dynamic support and resistance levels. These bands can be generated by the following formulas:
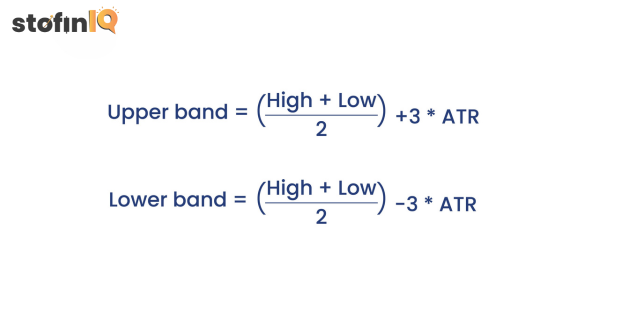
The high refers to the highest price of the period and the low refers to the lowest price of the period.
3. Plotting the supertrend line
The plotting of the supertrend line can be done using the upper band and the lower band.
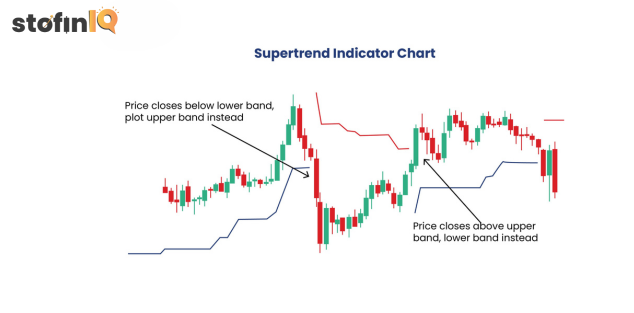
An uptrend will occur when the price over the period increases and goes above the upper hand. Now the supertrend line will go below the price and will turn green. This shows the investor that there could be an uptrend.
A downtrend will occur when the price over the period decreases and goes below the lower hand. Here the supertrend line moves above the price and will turn red. This shows a probable downtrend.
Advantages of supertrend indicator
Easy to use:
The indicator has no complication and it is extremely convenient to understand, it only includes a simple supertrend line, which makes it easy for beginners as well.
Clear signs:
The indicator shows clear signs and there are no chances of any confusion. This helps in increasing the chances of accuracy and hence provides overall benefits to the trader with better profit.
Risk management:
Supertrend can help the traders to minimize their losses, this is possible because it gives the trader the ability to understand the dynamic movements by setting the stop loss according to the market movements.
Disadvantages of supertrend indicator
Highly dependent on parameters:
The supertrend indicator is highly dependent on its parameters which are, the ATR and the multiplier, so if the parameters are not set properly, it will affect the supertrend and hence it will either make the analysis sensitive, either too frequent on the reversals or too delayed with the signals.
Lagging nature:
Supertrend uses past data for its analysis, so when there is an actual price movement it starts to lag. Thus there is a delay in entry or the exit points.
Can show errors in volatile conditions:
When the market is volatile the supertrend indicator fails to show accuracy, in such conditions it is not wise to use this indicator alone but for a proper analysis, other indicators shall be used.
How to adjust the parameters of the supertrend indicator?
The supertrend indicator comes with default settings that might not be suitable for all market conditions. Thus, it is important to adjust the parameters of the supertrend indicator.
The traders can adjust the sensitivity of the indicator as per the market variations. This way the trader can get better gains by understanding the market better.
This adjustment is also done based on Trading style, like Intraday trading or Swing trading.
Adjusting the ATR (Average true range) Period of the supertrend indicator
The ATR period indicates how many times the periods occur, this is sort of a measure of the market volatility. The ATR comes with a default ATR period of 10-14.
By making the ATR period shorter, the ATR becomes more sensitive to recent price changes, while a longer period helps in lowering the effect of volatility changes.
The best setting for the ATR Period is as per the trading style
1. Scalping (Ultra Short-Term)
- Best ATR Period: 5 to 10
- Reason: You want highly reactive volatility data to make quick in-and-out decisions.
- Use case: Tight stops and quick profit-taking on minute charts.
2. Day Trading
- Best ATR Period: 10 to 14
- Reason: Balances responsiveness and noise reduction for intraday volatility.
- Use case: Great for 5-min, 15-min, or 1-hour charts. Helps with setting stop losses and identifying breakout zones.
3. Swing Trading
- Best ATR Period: 14 to 21
- Reason: Smoothens out random price moves and shows broader trend volatility.
- Use case: Ideal for daily charts to set realistic stop-loss and take-profit levels.
4. Position Trading / Long-Term Investing
- Best ATR Period: 21 to 50
- Reason: Focuses on longer-term volatility and market cycles.
- Use case: Weekly or monthly charts, where the goal is to hold for weeks or months.
How to use the supertrend indicator?
- Apply the Indicator:
Add the Supertrend indicator to your chart. Default settings are typically Period: 10, and Multiplier: 3, but you can adjust them based on volatility or strategy.
- Buy Signal:
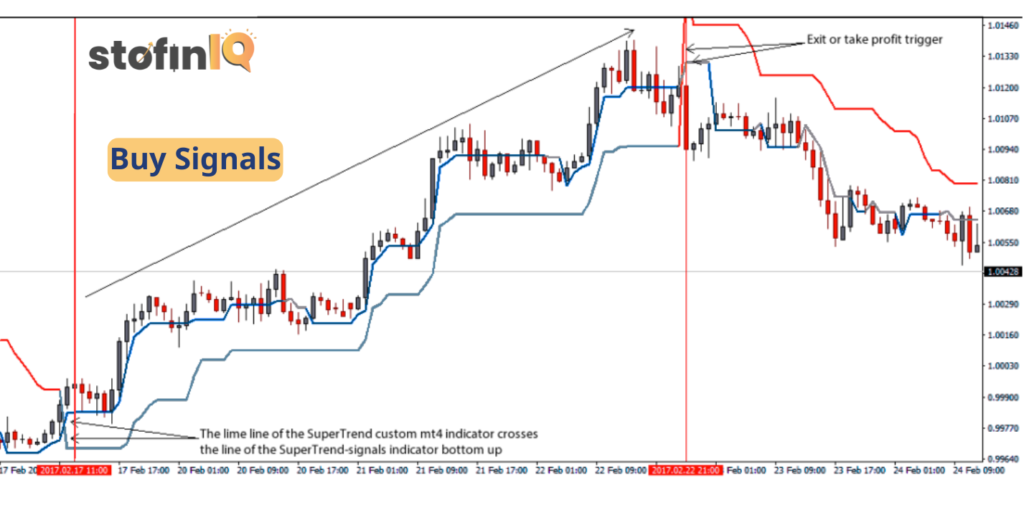
A buy signal occurs when the price closes above the Supertrend line. The line turns green and moves below the price, indicating a potential uptrend.
- Sell Signal:
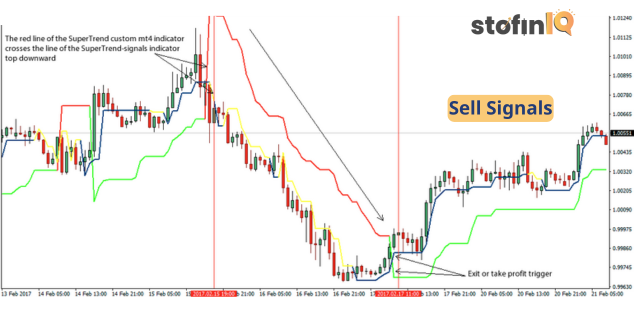
A sell signal is generated when the price closes below the Supertrend line. The line turns red and moves above the price, signalling a possible downtrend.
- Trend Confirmation:
Use Supertrend to confirm trends. Avoid trading against the direction of the Supertrend line.
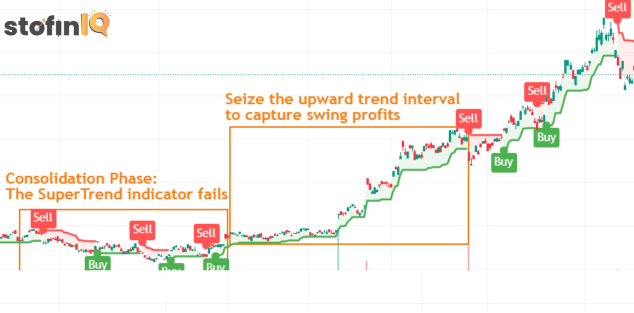
- Avoid Range Markets:
Supertrend works best in trending markets. In sideways markets, it may give false signals due to frequent whipsaws.
- Combine with Other Indicators:
Improve accuracy by combining supertrend indicator with tools like RSI, MACD, or Moving Averages for confirmation.
- Set Stop Losses:
Use the Supertrend line as a trailing stop loss level to protect your trades and lock in profits.
How to read the supertrend Indicator
The Supertrend indicator provides buy and sell signals based on the direction of the trend.
When the supertrend line is green, it indicates a bullish trend (the price is above the line)
This suggests a long position.
When the supertend line is red it means the trend is bearish, which shows that there are chances of shortcomings.
Buy Signal in Supertrend:
A buy signal is generated in the Supertrend indicator when the price closes above the Supertrend line, causing the line to shift below the price and turn green. This suggests a bullish trend, indicating it might be a good time to enter a long position. The crossover acts as confirmation that the momentum has shifted in favour of the buyers, and traders often use this as a cue to ride the upward trend until a reversal is signalled.
Sell Signal in Supertrend:
A sell signal occurs when the price closes below the Supertrend line, causing the line to flip above the price and turn red. This signals a bearish trend and suggests that it may be an opportune time to exit long positions or consider shorting. The indicator’s shift reflects increased selling pressure, providing traders with a visual confirmation that the market sentiment has turned downward.
Best Supertrend Strategies
Here are some of the best Supertrend strategies used by both beginners and experienced traders:
1. Dual Supertrend Strategy (Fast + Slow Supertrend)
Concept: Use two Supertrend indicators with different settings — one for short-term confirmation and another for long-term trend direction.
- Settings:
- Supertrend 1: 7, 2 (Fast)
- Supertrend 2: 10, 3 (Slow)
- Buy Signal: When both indicators turn green and price closes above both lines.
- Sell Signal: When both indicators turn red and price closes below both lines.
Works well in trending markets, and filters out noise.
2. Supertrend + Moving Average (EMA/SMA)
Concept: Combine Supertrend with a moving average (usually 50 EMA) to confirm trend strength.
- Buy Signal: The price is above both the Supertrend and the 50 EMA.
- Sell Signal: The price is below both the Supertrend and the 50 EMA.
Reduces false signals during consolidation.
3. Supertrend Breakout Strategy
Concept: Look for the price to break and close above/below the Supertrend line after a sideways consolidation.
- Buy Signal: Breakout and close above Supertrend after sideways movement.
- Sell Signal: Breakdown and close below Supertrend after sideways movement.
Effective for swing and positional traders.
4. Supertrend + RSI (Overbought/Oversold Filter)
Concept: Use RSI to avoid entering in overbought/oversold conditions.
- Buy Signal: Supertrend turns green + RSI crosses above 30.
- Sell Signal: Supertrend turns red + RSI crosses below 70.
Helps enter early in trends with good risk-reward.
5. Intraday Supertrend Scalping
Concept: Use lower timeframes (e.g., 5-min, 15-min) with tighter settings.
- Settings: Supertrend (5, 1.5)
- Entry based on crossover and exit on opposite signal or defined SL/TP.
Good for quick trades in high volatility periods.
Risk Management Tips:
- Always use a stop-loss just below/above the Supertrend line.
- Avoid using Supertrend during sideways or choppy markets.
- Combine with volume indicators for better confirmation.
How candlestick patterns and supertrend indicator are related?
Candlestick patterns and the Supertrend are similar in the sense that both give signals on market trends and possible price directions, but differently.
Candlestick patterns provide charting representations of price movements for a time, showing possible reversals or continuations of a trend.
The Supertrend indicator, through a mathematical function, determines trends and possible points of entry/exits, hence serving as a trend-following tool.
If used together both of these tools can enhance the overall analysis.
Can help in Trend Confirmation:
Candlestick patterns can confirm the direction of a trend indicated by the Supertrend. For example, a bullish engulfing pattern appearing after the Supertrend has signalled a buy, can strengthen the signal and increase confidence in the bullish trend.
Can signal trend reversals:
Both candlestick patterns and the Supertrend can signal potential trend reversals. Reversal patterns like doji or shooting stars can indicate a weakening of the trend, while the Supertrend changing from buy to sell or vice versa can also signal a change in direction.
Refinte entry and exit points:
Using both supertrend and candlestick patterns together can refine the entry and exit points for traders. For instance, a trader can use a Supertrend buy signal to enter a trade, and then a candlestick pattern (such as a bullish engulfing pattern) to confirm the buy and determine a stop-loss level. Likewise, when the Supertrend calls for a sale, a bearish candlestick pattern can confirm the sell signal and determine a profit-taking target.
Can filter false signals:
Candlestick patterns can be utilized to screen out false signals from the Supertrend. When a buy signal from the Supertrend is given, yet a bearish candle pattern is displayed, there may be a false signal, and the trader may decide not to take the trade.
FAQs related to supertrend indicator
The accuracy rate of supertrend can not be calculated like that because it depends on multiple factors like Confirmation, Risk tolerance, settings, time frame, asset classes and market conditions. Therefore it is difficult to calculate the accuracy rate of supertrend.
Yes, most of the time the supertrend is considered a lagging indicator. This is because it relies on past price action and volatility to determine the trends and it does not anticipate future movements.
The supertrend uses the ATR, average true range to calculate volatility.
This a two-step process
1. Calculating the ATR (average true range)

2. Determination of the supertrends Bands (Upper and lower bands)
The supertrend tool is a great tool for doing the analysis, with the proper adjustments of the parameters, this tool becomes very useful in a lot of places
But it is not stand alone and shall be used with the other tools when needed, During heavy volatility and market fluctuations, this tool shall be used very wisely.
If you’ve come this far, congratulations!
It shows your genuine interest in trading, the stock market, and overall finance.
To dive deeper into this domain:
- Don’t just stay tuned to our blog at Stofiniq—explore it actively!
- Want to understand finance, the stock market, and trading for free? Subscribe to our YouTube channel: Neeraj Joshi.
- Ready to take the next step? Download our app Neeraj Joshi application from the Play Store and enrol in our course on trading, mutual funds, and the stock market.
Start your financial journey today!
I left my engineering job to follow my true passion writing and research. A passionate explorer of words and knowledge, I find joy in diving deep into topics and turning rich, insightful research into compelling, impactful content. Whether it’s storytelling, technical writing, or brand narratives, I believe that the right words can make a real difference.