What Is the Butterfly Pattern in Trading?
The butterfly pattern is a harmonic pattern that traders use to spot potential price changes in the market.
- It has four main parts that make it look like a butterfly. It starts with a big price movement; then it shows the up-and-down trends.
- The butterfly pattern has two outer parts and two inner parts, which look like the butterfly’s wings.
- The butterfly pattern is observed by the traders when the market is neither too high nor too low, as this could be a signal that there is a price change.
By recognising these patterns correctly, the traders have a say on whether to buy or sell.
How do you identify the butterfly pattern on the chart?
The butterfly pattern can be identified by following these steps:
1. Look for a unique shape
The butterfly pattern consists of four main points. These points are labeled as X, A, B, C, and D. The butterfly shape is created by the price movement.
2. Identify the key point
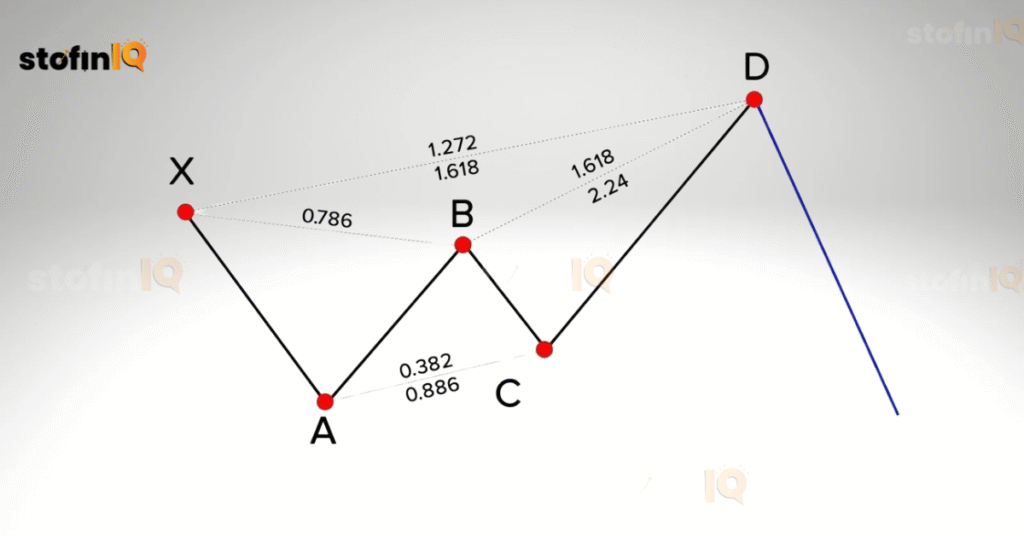
- Point X
Point X is the starting point from where the initial price movement occurs. - Point B
A retracement usually moves down to a level where it is between 78.6% and 88.6% of the distance from X to A. - Point C
A new high forms – this is mostly near the 38.2% to 88.6% of the distance from A to B. - Point D
The point where the pattern completes often targets the 161.8% or 224% extension of the move from X to A.
3. Check the Fibonacci ratios
Confirm that the price movements between these points align with the Fibonacci retracement and extension levels, as these are the main keys for confirming the butterfly pattern.
4. Volume confirmation
Check if there is any increase in the price; as it reaches a point, D; this signals a potential strength in the reversal.
5. Check the timeframe
The butterfly pattern can be confirmed by checking the timeframe, as it is more reliable on the higher time frames, like daily or weekly charts.
Advantages of butterfly pattern
Here are the advantages of the butterfly pattern:
- Limited risks
The butterfly pattern has a defined structure for profit and loss. This means that the maximum potential loss is known beforehand; this is because it involves the selling and buying of options at specific strike prices.
- Profit potential
Using a butterfly strategy can provide a higher risk-to-reward ratio if the underlying asset’s price moves as calculated. This means the profit potential as compared to the initial risk is higher.
- Market Neutrality
If the price settles close to the middle strike price expiration, there can be a potential profit. This shows that the butterfly pattern can be structured to be market-neutral.
- Flexibility
The trader can adjust the number of strike prices and personalise the strategy as per their outlook; this makes it adaptable to the market conditions.
- Requires lower capital
Compared to other strategies, the butterfly requires less capital, which makes this strategy accessible to most traders.
- Easy to manage
Since the profit-loss structure is predefined, the trader can see when to close positions or take profits based on the movements of the underlying assets.
- Ideal for range-bound market conditions
The butterfly pattern is mostly effective in range-bound markets, where the price is not expected to make significant moves. This helps the traders to gain profit from the minimum price fluctuations.
Disadvantages of butterfly pattern
Here are the disadvantages of the butterfly pattern:
- Limited profit potential
Yes, the butterfly can provide better gains, but the maximum gain is the structure of the trade. So the profit is usually capped.
- Time decay sensitivity
If the value of the underlying asset does not move towards the strike price,The value of the options may decline, and this might lead to a potential loss.
- Low probability of the exact execution
The maximum profit is achieved only when the underlying price closes in the exact middle strike price. The probability of it happening as such is pretty low.
- Higher transitions cost
The butterfly pattern has multiple legs (which means that the buying and selling have been done at multiple strike prices), so there are additional costs and they might eat up the profits
- Dependent on the market conditions
The butterfly strategy is best in a bit stabler market conditions. When the market is volatile, the strike price fluctuates sharply and moves away from the desired strike price. This leads to potential losses.
- Greater margin requirement
The butterfly strategy might require a higher margin depending on the brokerage and the specific setup of the butterfly.
What does the butterfly pattern tell the traders?
The trader gets the following insights from the butterfly pattern:
- Potential trend reversal points
With its defined retracements, the pattern helps to identify areas where the price might hesitate or reverse the direction.
- The entry and exit points
The pattern helps the trader to enter the trade in a bullish or a bearish direction and also helps the trader to identify where to place a stop-loss order to limit the risk.
- Target the price levels
The pattern helps the trader to predict potential target prices for a trade; this allows the trader to set the profit order and manage the profit.
- Trend reversal signals
The trader can analyse the patterns to find the potential trend reversal, which is either bullish or bearish.
How to trade the butterfly pattern?
The butterfly pattern can be traded by the following steps:
- Identify the pattern
The butterfly pattern usually has a distinct shape; like its name, it resembles a butterfly with a series of peaks and troughs.
Look for the specific points (X, A, B, C, D) in the pattern.
- Confirm with other indicators
You can use other indicators (like RSI, MACD, or volume analysis); this will help you confirm the strength of the pattern. Check the signs of the potential reversal or continuation.
3. Determine Entry and Exit Points
- Entry: most of the time you might enter the trade at point D, where price action confirms the pattern.
- Stop-Loss: Place a stop-loss order beyond point X or A to manage risk in case the pattern fails.
- Take Profit: Identify potential profit targets based on the previous highs or Fibonacci retracement levels.
4. Monitor Price Action
Analyse by keeping a close watch on how the price reacts after you make your entry. If you notice that the prices are moving in your favour. Then adjust your stop loss to lock in the profits.
5. Practice Risk Management
Just like any other strategy, make sure that you have a good risk management plan to secure your money.
Tips for trading the butterfly pattern
1. Choose the Right Market Conditions:
Butterfly spreads perform best in low-volatility or sideways markets. Always make sure that the underlying asset isn’t undergoing significant price movements that could negate your strategy.
2. Know Your Strike Prices:
Be careful when you select your strike prices based on the asset’s historical price action and your market outlook. The middle strike price should ideally represent a realistic target for where you expect the underlying to be at expiration.
3. Utilise Technical Analysis:
Use charts and technical indicators to check potential reversals or support/resistance levels. This will help you in making informed decisions about when to enter and exit trades.
4. Pay Attention to Implied Volatility:
Implied volatility can impact the pricing. Try to look for setups when implied volatility is high, as this can increase premiums, allowing you to benefit from the potential decay as the expiration approaches.
5. Manage Time Decay:
Keep an eye on how time decay affects your options. As expiration approaches, the value of your options may decrease, so positioning yourself early enough can be beneficial.
6. Limit Your Exposure:
Because butterfly spreads have a defined risk, always consider how much capital you are willing to commit. It’s wise to risk only a small percentage of your trading capital on each butterfly spread.
7. Adjustments May Be Necessary:
Be open to making adjustments if the market sentiment changes or if the underlying price moves significantly away from your anticipated target.
8. Practice Makes Perfect:
If you are a beginner, try to do paper trading with an account to practise executing butterfly spreads before committing real money. This will help you build confidence and refine your approach.
FAQ (Frequently Asked Questions)
It is the descending wave XA that produces a bearish butterfly. The trend should decline once the design is finished. As a result, traders earn from short sales.
A butterfly harmonic pattern is a specific type of price pattern used in technical analysis. It is part of the family of harmonic patterns, which are based on Fibonacci ratios and designed to identify potential reversal points in the price of an asset.
The Butterfly harmonic pattern comes in two variations
Bullish indicates a potential trend reversal upwards, and bearish indicates a potential trend reversal downwards.
Congratulations on reading this far; I hope you found the insights on the butterfly pattern helpful. If you’re interested in diving deeper into finance, mutual funds, and stock market trading, don’t forget to check out our blog, StofinIQ, for more valuable content!
Reference:
I left my engineering job to follow my true passion writing and research. A passionate explorer of words and knowledge, I find joy in diving deep into topics and turning rich, insightful research into compelling, impactful content. Whether it’s storytelling, technical writing, or brand narratives, I believe that the right words can make a real difference.