
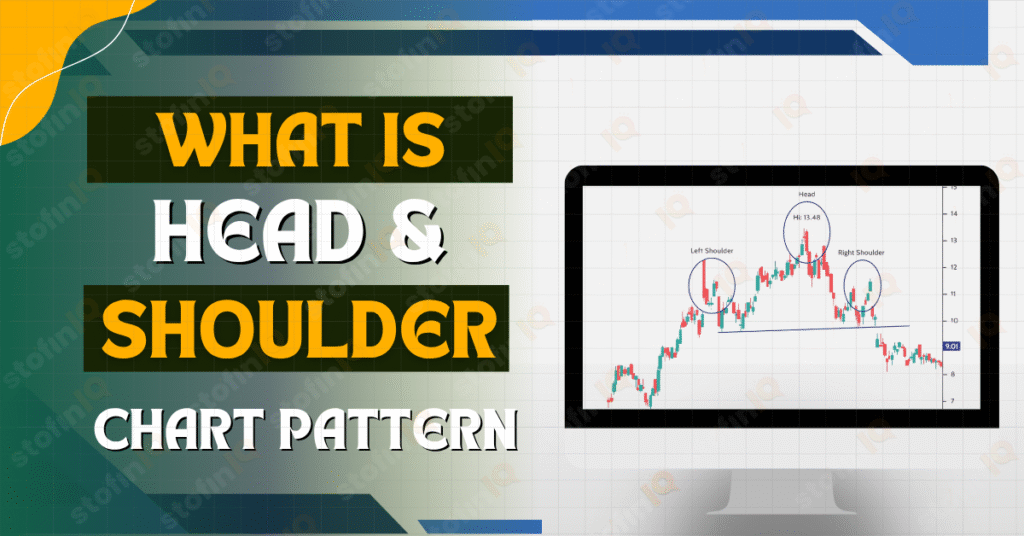
The world of technical analysis has a lot of chart patterns that are indicators for the eye of what may happen in the market. There is such a pattern that often attracts the attention of the traders, and it is the inverse head and shoulders. This formation can be identified by its unique form – a low that is surrounded by two higher lows – and it usually is formed at important turning points.
But what is it really a signal of? Is it just a hint that the prices might go up or a sign of further drop? In this blog, we are going to talk about the structure of the Inverse Head and Shoulders pattern, where it is found and what market behaviour is usually represented by this pattern – enabling you to determine whether it is a bearish or bullish leaning pattern.
Key Takeaways
- The inverse head and shoulders pattern is usually viewed as being a bullish sign of reversal.
- It normally follows a downtrend and indicates that the selling pressure is drying up.
- The pattern will be established once the price breaks out of the “neckline” with a good volume.
- There may be false breakouts, so confirmation and risk management become necessary.
- The pattern can be combined with other technical tools to help intensify your analysis.
Understanding the Inverse Head and Shoulders Pattern

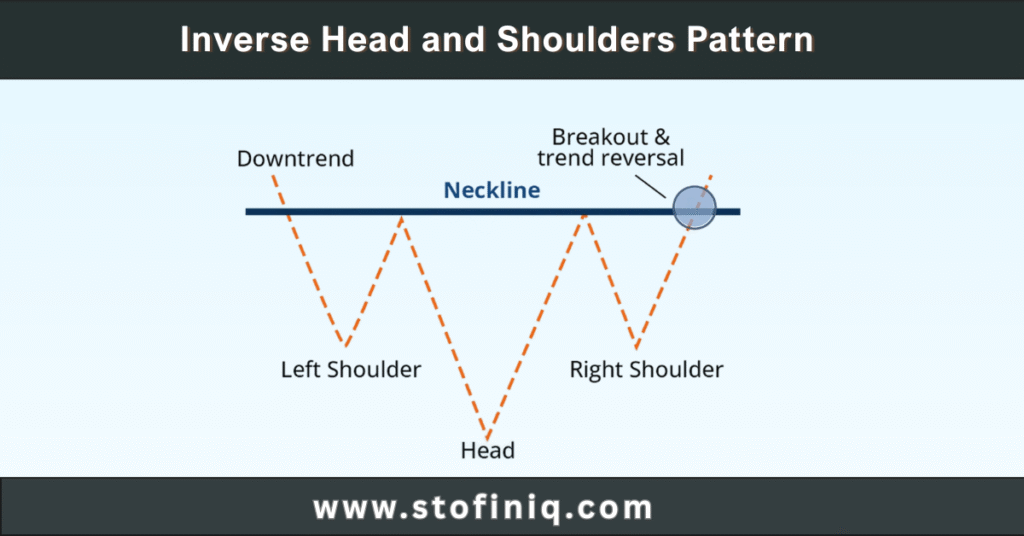
This pattern gets its name because it looks like an upside-down version of the classic Head and Shoulders pattern. It’s made up of three main parts:
- Left Shoulder: A temporary low followed by a minor rally.
- Head: A deeper low that represents the lowest point in the pattern.
- Right Shoulder: A higher low that mirrors the left shoulder, signalling reduced selling momentum.
Above these three troughs lies the neckline, a key resistance level. When the price breaks above this neckline, it’s often taken as confirmation that the trend is reversing from bearish to bullish.
Key Features of the Inverse Head and Shoulders
Let’s take a closer look at what defines this pattern:
- Formation After a Downtrend: The pattern is meaningful if it is formed after a downtrend.
- Three Troughs: The central low (the head) has to be lower than two shoulders
- Neckline: A horizontal or slightly sloping resistance line which will connect the peaks in between the head and shoulders.
- Breakout Confirmation: A bullish overthrow is confirmed once there is a breakaway above the neckline. Great volume during the breakout provides more evidence of the signal.
Why Is It Considered Bullish?
The pattern reflects a shift in market sentiment. Here’s what it tells us:
- The first low (left shoulder) indicates that sellers are the ones in charge.
- The deeper second low (head) could indicate that selling pressure is intensifying – but when buyers occur immediately and push the price back higher, rumbling eyebrows would be a good bet.
- The third low (right shoulder) is not so deep, indicating that sellers are losing strength.
- A breakout above the neckline confirms that the buyers are entering with fire.
This transition from lower lows to higher lows and then a resistance breakout points to a bullish reversal.
How to Trade the Inverse Head and Shoulders Pattern
Entry Point
Once the price breaks above the neckline, that’s your potential entry signal.
- Buy Order: Consider placing a buy order slightly above the neckline to catch the breakout.
- Volume Check: Make sure there’s good volume to support the breakout; otherwise, it could be a trap.
Stop-Loss Placement
Risk management is key in any trading strategy.
- Stop-Loss: Place it just below the right shoulder or below the head, depending on your risk tolerance.
- Buffer Zone: Give your stop-loss some breathing room in case of minor pullbacks.
Target Price
The projected move can be estimated by measuring the distance from the head to the neckline.
- Price Target: Add that distance to the breakout point above the neckline.
- Adjust as Needed: Modify your target based on market structure or key resistance levels ahead.
Common Mistakes to Avoid
Even though this is a popular pattern, it’s not foolproof. Here are some pitfalls to watch for:
- Trading Without Confirmation: Jumping in before a clean neckline breakout can be risky.
sustained by - Ignoring Volume: A weak breakout with low volume may not be sustained.
- Forcing the Pattern: If it doesn’t fit clearly, don’t try to make it one. Ambiguous shapes are not reliable.
- Neglecting Market Context: Always consider the overall trend, nearby support/resistance, and external factors like news or earnings.
Using the Pattern With Other Tools
To improve the reliability of this setup, combine it with short technical indicators:
- Moving Averages: A crossover or alignment of short- and long-term averages can support the breakout thesis.
- RSI or MACD: Look for bullish divergences or a crossover that aligns with the breakout.
- Support/Resistance Zones: The neckline breakout occurring near strong historical resistance can add conviction.
- Trendlines and Channels: Use them to check if the breakout aligns with broader trend structures.
Variations and Similar Patterns
While the classic Inverse Head and Shoulders is clear, there are variations:
- Sloping Neckline: Sometimes the neckline tilts slightly upward or downward. It’s still valid but requires closer attention.
- Multiple Shoulders: Occasionally, the pattern has more than one left or right shoulder. Traders call this a complex head and shoulders.
Not to Be Confused With
- Regular Head and Shoulders: This one appears after an uptrend and is bearish in nature.
- Double Bottom: A W-shaped pattern, also bullish, but without the central “head”.
Pros and Cons of the Inverse Head and Shoulders Pattern
Advantages
- The clear structure makes it easy to spot once you’re familiar with it.
- The inverse head and shoulders pattern can be useful for identifying trend reversals at key points.
- Can provide defined entry, exit, and risk management levels.
- Often appears in both stocks and crypto markets, offering wide application.
Limitations
- Can generate false breakouts, especially in low-volume environments.
- Doesn’t guarantee success—requires confirmation and supporting analysis.
- Doesn’t work well in sideways markets or noisy conditions.
- Not every pattern plays out as expected—market conditions matter.
Final Thoughts
The inverse head and shoulders pattern is generally considered a bullish reversal pattern. It’s a classic sign that the tide may be turning in favour of the bulls. But like any trading pattern, its context, confirmation, and cautious execution. Always use a combination of other tools and confirm.
Hopefully, your questions have been answered. A good investor continuously learns. To explore various finance topics such as trading, the stock market, investing, and mutual funds, visit our blog: StofinIQ.
Reference:
Inverse Head and Shoulders: What the Pattern Means in Trading
I left my engineering job to follow my true passion writing and research. A passionate explorer of words and knowledge, I find joy in diving deep into topics and turning rich, insightful research into compelling, impactful content. Whether it’s storytelling, technical writing, or brand narratives, I believe that the right words can make a real difference.
Pingback: Buy the Breakout: When the Inverse Head and Shoulders Pattern Screams ‘Entry Now – StofinIQ