What is the Dragonfly doji candlestick?
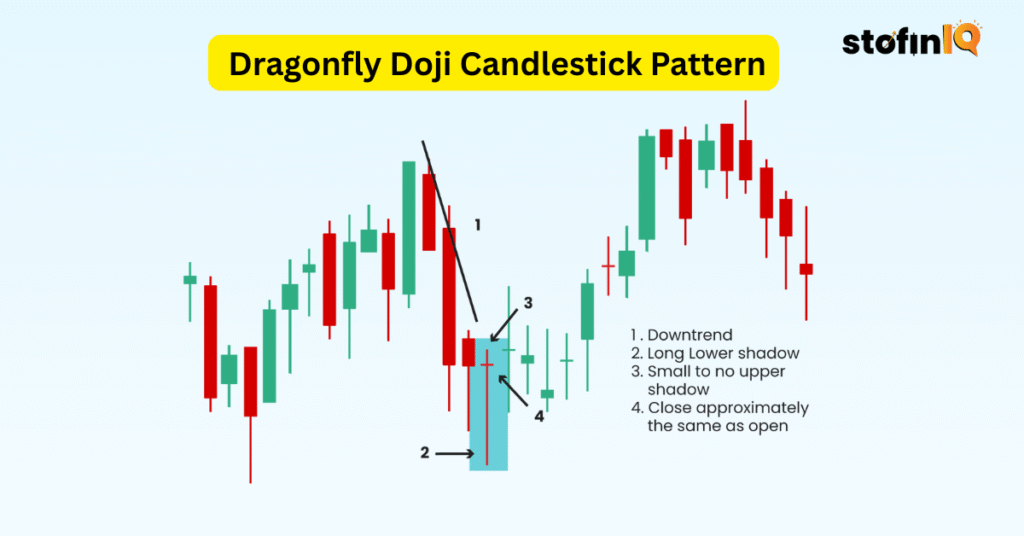
A dragonfly pattern is a type of Doji candlestick pattern. This pattern looks like the letter “T”, and this is formed when the price drops by a big margin during the day, but it goes back and then closes near where it started.
This pattern shows that the buyers are becoming stronger, and the price of the stocks might soon go up.
Key Takeaways
- Definition: The Dragonfly Doji is a candlestick and is in the shape of a (T). The open price, high and close price are almost equal, and the lower shadow of the candlestick is long, indicating that there is a conflict between buyers and sellers.
- Signifies Possible Reversal Momentum: It is normally seen following a fall and has the indication that a bearish momentum could be losing its grip, which designates a possible recovery in the opposite direction, that is, bullish.
- Demonstrates Action of Buyer Power: Sellers set the tone down throughout the session to the extent that close buyers turned the situation to the previous opening price.
- Confirmation is vital: Only the pattern is not sufficient; traders want to see a powerful bullish day bar on the following day to mark the trend change.
- Greater Near Key Levels: The signal is more certain when it develops at support levels, long-term moving averages, or even in oversold states such as low RSI.
- Do not trade Sideways Markets: The Dragonfly Doji will become insignificant on choppy or non-trending markets and may provide erroneous signals unless the context is provided together with volume support.
What does the Dragonfly Doji indicate?
Dragonfly Doji shows that there might be a reversal of the market direction, preferably following a decline.
It indicates that sellers forced the price lower during the session, but the buyers raised it to the opening level by the end. What this means is that Buyers are becoming powerful
What does it mean?
Following a downtrend: There is a bullish reversal possibility (the price may move upwards).
It may indicate indecision or even a slowdown after an uptrend.
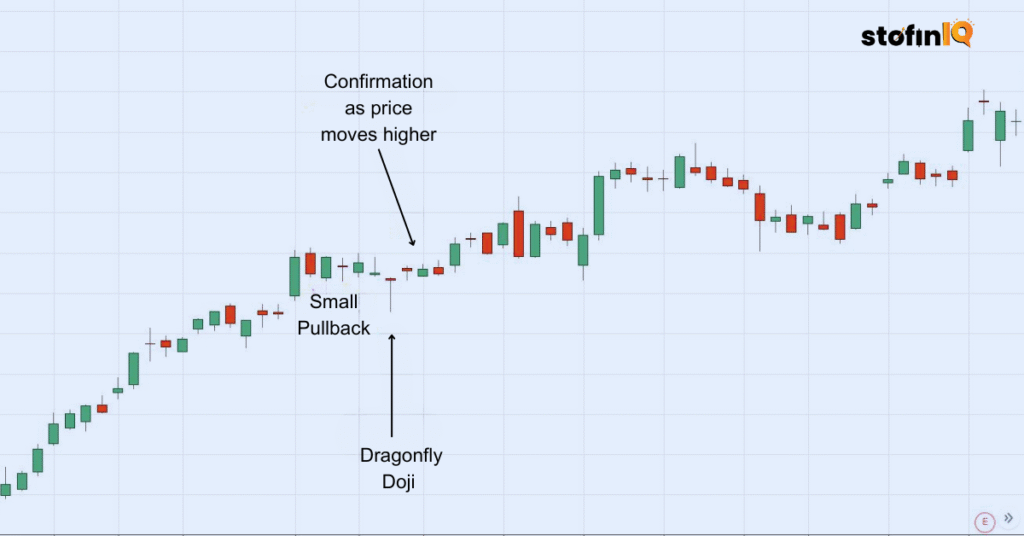
Dragonfly Doji is an indication that buyers are coming out to attack, and a change of route may occur, especially from downwards to upwards. Traders, however, normally wait for the next candle to confirm them.
Where and when should the Dragonfly Doji pattern be used?
Dragonfly Doji is a candlestick pattern that usually indicates that there could be a change in the trend, especially after a decline. It appears when the open, close and high prices are nearly similar, and there is a long lower shadow, which shows that sellers forced the price to go down in the session, but the buyers were able to reclaim it by the end of the session.
This battle of tug proposed that selling pressure is becoming tired, and it is possible that buyers are coming in. Yet this is not a pattern to be utilised alone; there should be a doubling of the signal with other signals or in the subsequent price movement.
When in a downtrend: The pattern is best used following a strong downtrend, when it can signal that bearish momentum is abating and that a bullish change in direction would occur.
Near powerful support: In the event of the Dragonfly Doji that forms within a powerful or major support zone or anytime close to a long-term moving average (or 100-day and 200-day MA), the signal receives greater credibility as a reversal signal.
In oversold situations: In an oversold state, when technical tools such as RSI (Relative Strength Index) or Stochastic Oscillator indicate that the asset is oversold, a Dragonfly Doji may serve as an indication of a reversal.
After verification by the succeeding candle, A bullish candle after Dragonfly Doji gives assurance that indeed, buyers are getting to the fore. The signal is not confirmed, and unsure.
In high volume conditions: When the Dragonfly Doji is made on high volume, it gives the pattern more strength since it indicates the heavy involvement of buyers in returning the price higher.
When not to follow the Dragonfly Doji pattern
In choppy or sideways markets: In a sideways or choppy market, the Dragonfly Doji is not as predictive when there is no clear trend leading up to it.
Not having subsequent confirmation: this pattern does not have long-term confirmation, and no signal to act on this pattern can take place immediately, but let the next candle confirm the reversal.
Confirmation signals for the Dragonfly Doji pattern
The key to the Dragonfly Doji trading based on the pattern is confirmation that it is merely a sign of indecisiveness or the signs of the reversal, but not confirmation. A correct verification makes traders certain that there is actually a reversal or a change in trend.
These are the main confirmation indicators to watch out for after the occurrence of a Dragonfly Doji:
1. Bullish Candle Day after
A bullish candlestick with a strong green colour, which penetrates above the close of the Doji, closing even higher.
Shows that the indecisiveness demonstrated by the Dragonfly Doji was skirted, and the buyers have emerged as victors.
2. Increased Volume
An above-average volume on the day of or following the Dragonfly Doji improves the signal.
Has a good involvement of buyers around the turnaround.
3. Above Doji High
In case the subsequent candle equals or collapses above the Dragonfly Doji high, it is a typical authentication marking.
Traders usually purchase a lot of entries for technical traders.
4. Bullish Divergence RSI / MACD
In case the price created a lower low, but RSI or MACD created a higher one, it is observed that there is a bullish divergence.
And when it occurs together with Dragonfly Doji, the chance of the reversal will be greater.
5. Support Level Room
When a Doji is formed on or around a known support line, and the following day the price honours that support line, then it is evidence in favour of a reversal.
6. Gap Up Opening
When the following day gap-enlargements are considerably above the Doji close, it indicates early bullish interest.
This is a good sign of bullish force.
7. Pattern in a Wider Arrangement
When the Dragonfly Doji is a part of a bigger bullish formation (such as double bottom, falling wedge or bullish flag), the setup is more consistent.
Caution: Unconfirmed, the Dragonfly Doji is merely an indication of indecision, but not a trade entry. Never take a position without waiting for at least one of the signals above.
How to trade with the Dragonfly Doji pattern: Step by Step
The following is a step-wise procedure that shows how to trade based on the Dragonfly Doji candlestick pattern and, in particular, after a bear trend. It aims to employ this pattern to be able to determine some possible bullish reversals and to properly enter and exit.
Step 1: Identify the pattern
- Search for a Dragonfly Doji following a definite downtrend or a price adjustment.
- The long, long lower shadow in the candle must be accompanied by the open, the close, and high prices close to each other.
It is an indication that the buyers took the price in an upward direction after the sellers took centre stage in the session.
Step 2: Check the context
- It should be ensured that the pattern is at an important support point, trendline or moving average level.
- Ensure that the market is not on the sideways scheme because this scheme is weaker during periods of consolidation.
Step 3: Seek confirmation
When to follow through:
- Wait for the next candle to indicate the reversion.
- A very strong confirmation is a bullish candle which closes above the top of the Dragonfly Doji.
- The signal can be reinforced with an increase in volume or a gap up.
Step 4: Plan the trade
Pay attention to this trade and devise ways to make it successful.
As soon as confirmation emerges, design your trade:
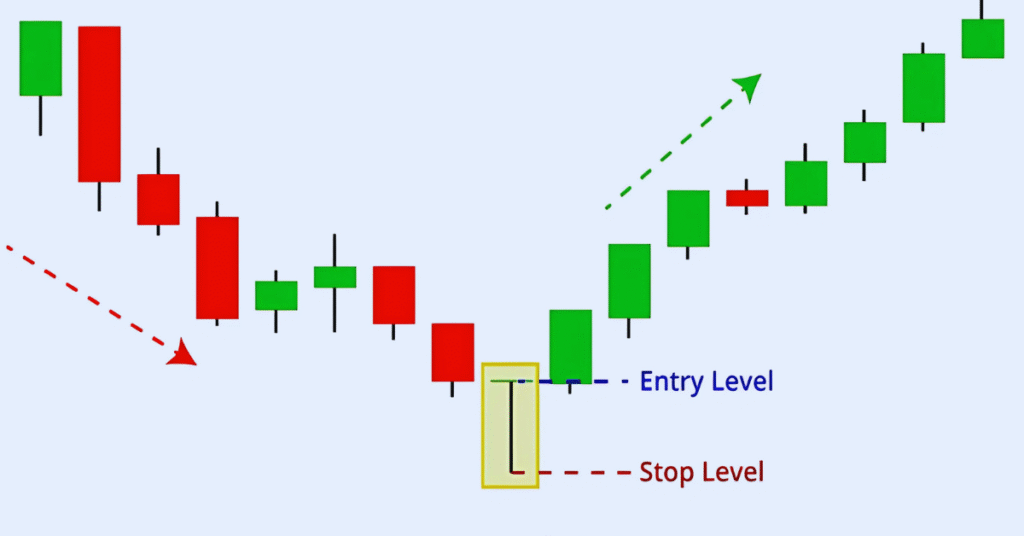
Entry point: Get in the trade above the high of the confirming bullish candle.
Stop Loss: Place your stop-loss under the low of the Dragonfly Doji in order to limit the risk.
Target Price: A Realistic target should be set on the basis of:
- Previous resistance levels.
- Fibonacci retracement levels.
- Risk-to-reward ratio (should be 1:2 or better).
Step 5: Trade monitoring and management
Be on the lookout for slowing momentum.
- When price is fighting at resistance, it would be good to have partial profit.
- Put a stop-loss on the market to exit and book profits as the price trades above your position.
Example:
| Pattern | Dragonfly Doji after downtrend |
| Confirmation | Bullish candle closing above Doji high |
| Entry | Above confirms the candle’s high |
| Stop-loss | Below Doji’s low |
Advantages of a Doji dragonfly candlestick pattern
The Dragonfly Doji candlestick pattern comes with several advantages, mainly when it is used in the right context of the market. It is a very important signal for the traders who are looking to spot a potential trend reversal or areas of buying interest after a period of selling pressure.
These are the main advantages of the Dragonfly Doji:
1. Indicates the possibility of reversal following a downtrend
Once a decline in a stock is observed, followed by the Dragonfly Doji, it is an indication that selling strength is growing weak.
It shows a recovery in the mood after being bearish to the possible bullish turning point, as it shows an early indication of a reversal.
2. Definite Optical Proto-decision in the Marketplace
The trend indicates that, despite the control that the sellers had during most of the session, buyers managed to push the price of the commodity up as it closed.
Such a change forms a psychological pivot on the market.
3. Creating Competing, Around Support Zones
The Dragonfly Doji used near support levels, trendlines, or some other key moving averages serves as great confirmation supporting that support is holding.
It boosts the confidence of the trader to get into long positions.
4. Helps in Risk Management
The long lower shadow provides an obvious point of placing a stop-loss (just beneath the wick). This helps significantly in risk management.
Various traders are able to establish trades with low risk and high return possibilities, resulting in the enhancement of the risk-reward ratios.
5. The information is helpful and applicable over a number of periods
The trend can be used as a daily, hourly, or even weekly chart, which implies that it is convenient both to short-term traders and long-term traders.
6. Plays Nice with Confirmation
It forms an excellent and certain signal when it occurs together with a bullish confirmation candle, volume, or with technical indicators.
7. There is no necessity for complex indicators
The pattern is based on price action only, and this makes it helpful to the trader who likes clean, indicator-less charts.
Disadvantages of the Doji Candlestick Dragonfly Pattern
Although the Dragonfly Doji candlestick pattern may be used as a helpful tool in technical analysis, it still has numerous drawbacks that traders are getting to realize that they should be aware of. It can easily give false alarms and result in bad trading strategies when used blindly.
The major drawbacks of Dragonfly Doji are the following:
1. Requires Confirmation
The trend alone does not serve as a good indicator. It simply indicates indecision, or a possible flip-flop.
It is dangerous to be in a trade based on Dragonfly Doji only unless a bullish confirmation candle appears later.
2. Clearly Is Mistaken Easily
The confusion of the Dragonfly Doji with other kinds of candles, such as a hammer, is easy.
This may be a cause of misunderstanding the target market, even among the new entrants.
3. Having a Loss to Sideways or Choppy Markets
During non-trending situations, there is also a likelihood that Dragonfly Dojis may occur and do not mean any significant reversal.
This leads to the emission of false signals and additional trades.
4. Lowly Reliability Absent Volumes Analysis
Volume plays a very key role in determining the power behind the trend.
In the case where it develops over low volume, the signal can be poor or unreliable.
5. Does Not- imply Strength of Reversal
The Dragonfly Doji does not determine the strength of the reversal despite the confirmation.
The bounce is sometimes short-lived or it is an upswing within a bigger downtrend, thus resulting to premature entries.
6. Market Noise (Subject to)
Since it is founded on only one candle, the Dragonfly Doji can be easily swayed by unpredictable price fluctuations or news that produces a different interpretation.
7. Lagging Entry Signal
Better entry prices might have been available by the time confirmation was made.
This is able to minimise the reward-to-risk ratio of the trade.
The alternatives to the Doji dragonfly candlestick pattern?
There are a number of candlestick patterns that may also be used instead of Dragonfly Doji, particularly when you want to find indicators of a bullish reversal or aim to detect buyer power in a free fall. Such patterns can provide clearer indications or more substantial confirmations based on a situation.
These are the most popular variations:
1. Hammer
- A long lower shadow and a small body on top.
- Forms following a decline could present an indication of a reversal.
- The hammer, unlike the Dragonfly Doji, has a bigger body showing stronger buying pressure.
2. Bullish Engulfing
- After this small red candle, we have a big green candle which totally covers the earlier body.
- A good indicator of a change from selling pressure to buying pressure.
- It is more convincingly confirmatory than a Dragonfly Doji.
3. Morning Star
- Three candlestick pattern: Three-candle: bearish candle, small-bodied candle (doji possible), and strong bullish candle.
- Significant changes in momentum and traders are likely to use it when seeking to reap more reliable setups of reversals.
4. Piercing Pattern
- A demonstrated bullish reversal pattern is when the green candle opens below the low of the previous red candle and closes beyond the midpoint of the previous red candle.
- It has a high buying interest following a pullback.
5. Inverted Hammer
- Shows up following a correction trend, and the body is small, and the upper shadow is long.
- Shows that buyers had attempted to gain control, but this must be confirmed by the following bullish candle.
If you’d like to read about another bullish reversal pattern, check out the Inverted Hammer candlestick — a signal that often appears at the bottom of a downtrend, much like the Dragonfly Doji. Read more here.
Hammer vs Dragonfly Doji
Both Doji, the Hammer and Dragonfly are bullish reversal candlestick patterns that are usually formed upon a fall, although they differ slightly in the manner of reflecting future market moods.
The real body of the hammer is tiny at the top of the candle, and the lower shadow can be huge, which means that the sell-off pressure in the session caused the closings to be below the price, but buyers closed higher than the low, often higher than the open, when green. This indicates more robust buying pressure, and it brings the pattern to be more precise and convincing.
On the contrary, the Dragonfly Doji exhibits virtually no actual body, open, close and high prices are virtually similar, and a long lower shadow. In the same way, it indicates that the buyers caused the price to move back up after intense selling moved it lower, but the fact that it took the price back to the open, as well as being very close to it, indicates more doubt than confidence.
Due to this fact, the Hammer can generally be trusted over the Dragonfly Doji, and a trader will seek to be more certain on a Dragonfly signal before committing to relying on it.
In case you want to learn more about the other side of the candlestick spectrum, when bullish trends begin fading, then you can take a look at the post on the Shooting Star candlestick pattern that is a definitive bearish reversal indicator.
FAQ (Frequently Asked Questions)
To understand what a dragonfly doji indicates?
We must first understand the red Doji. The red Doji shows that in spite of the fact that the sellers had moved the price much lower in the session, the buyers had been able to move the price towards the opening price before closing the terminal lower than the opening price.
This indicates a buying interest, along with some hesitation, which can be considered as a possible bullish reversal signal, especially when used after a downtrend, but it needs the confirmation of the next candle.
The green Dragonfly Doji suggests that buyers have attempted to take the session earlier and had moved the price lower, but the sellers had intervened and pushed it higher to close just above the inception of the session.
This indicates a very high bullish probe and a possibility of reversal of a trending period, particularly after a negative trend. The green body contributes extra power to the signal as opposed to a red Dragonfly Doji; however, confirmation by the subsequent candle is also vital prior to making a move.
The Dragonfly Doji Candlestick pattern is a dependable indicator, and it can be used in a favourable way, namely in a downward direction, when it is usually located at the trend lows. It shows that at the open, the sellers brought the prices down, but then the buyers were able to take the initiative before the day ended, thus showing a possible bullish reversal.
Nevertheless, this is not one of the candlestick patterns that should be used on a stand-alone basis. It is more reliable when it is supported with volume, prices at support areas, or other technical elements. When it comes to traders, it is actually a great warning indicator or confirmation aid, but not an independent entry indicator.
The Dragonfly Doji candlestick pattern can be found when the open, the close and the high prices are almost the same almost with a long lower shadow or no upper shadow resembling a T. It normally follows a down trend and may indicate possible recovery. Look out for support levels and never consider taking action on the next session unless a bullish confirmation candle is made.
The best suitable time to trade in terms of the Dragonfly Doji pattern with candlesticks is in case it occurs after an obvious downtrend, preferably at or close to a powerful support line, and it is pursued by a bullish intervention candle. Such an arrangement implies that the selling pressure is fading and buyers are gaining momentum, and therefore, there is a probability of a breach of trend.
The time is better to wait till the next trading session opens and a bullish candle closes above the high of the Dragonfly Doji. This validation assists in eliminating misleading cues. Do not trade the pattern in sideways markets or in isolation since the Dragonfly Doji only indicates indecision as opposed to direction.
The trading strategy of the Dragonfly Doji is aimed at identifying a pattern that is clouded with a downtrend, and as a result, it is an indicator of a possible bullish reversal. Traders are awaiting a confirmation candle that closes above the Doji high before taking a long position and setting the stop-loss just beneath the low of the Doji. Conversely, the Gravestone Doji follows an upward trend pattern and indicates that a bearish reversal might come.
A short position may be taken once a bearish candle confirms the pattern and closes below the low of the Doji, and the stop-loss is placed above the Doji high. In both scenarios, confirmation becomes a prerequisite, and the patterns are most effective when they form within the close vicinity of important support or resistance areas.
The Gravestone Doji is the opposite of the Dragonfly Doji candlestick pattern. Though both the Dragonfly Doji and the Gravestone Doji are made with long lower shadows, the former indicates a possible bullish reversal, whereas the latter has a long upper shadow and the close, open and low prices quite close, meaning that it indicates that there might be some bearish reversal, particularly following an uptrend.
It shows considerable selling pressure as people had moved the price higher throughout the session, but were not able to sustain the gains at the end of the session.
Dragonfly Doji is usually called a bullish candlestick pattern, particularly when it is found following a downtrend. It indicates that sellers put it lower in the session, but it was raised by buyers to near the beginning point. Such a change of momentum indicates that buying pressure is resurging and can therefore be viewed as leading to a bullish reversal but confirmation should be sought by the subsequent candle before acting upon any such signal.
Congratulations on finishing this blog! Hope this was informative and you decided to read more on the share market, share trade strategies, mutual funds and all that concerns personal finance. do remember to follow StofinIQ on a regular basis to get regular updates, tips and information.
I left my engineering job to follow my true passion writing and research. A passionate explorer of words and knowledge, I find joy in diving deep into topics and turning rich, insightful research into compelling, impactful content. Whether it’s storytelling, technical writing, or brand narratives, I believe that the right words can make a real difference.