Charts and patterns in the stock market can be overwhelming to read, seeing them everywhere might remind you of the maths class you left long ago, especially for someone who is a beginner in the stock market, to have a strong understanding of the candlestick patterns could be very important and in long term journey of the stock market, this could be very beneficial for becoming a part of the trading game.
Understanding the candlestick patterns makes you understand what the big market bulls and bears are doing. Candlestick patterns are considered to be the most reliable charts, using candlestick patterns you can understand all the trading signals .
If you don’t understand these patterns the market might easily take away your money and you might face a major loss because these patterns are used by all the big games of the market.
What is the origin of the candlestick pattern?
The candlestick pattern is known to have an origin back to the 18th century, back then this was used by Munehisa Honma (1724–1803) who was a rice merchant and used the charts to trade rice in the rice market of Osaka. The organised use of candlestick patterns came in around the beginning of the 1950s.
Munehisa Honma is considered to be the most famous candlestick trader, who published his work, “The Fountain of Gold” and made a profit of around 10 billion dollars in today’s money.
Key Takeaways
- A candlestick pattern is a graphical representation of price movements, it is displayed on a candlestick chart and used in technical analysis to identify potential market trends and reversals
- The candlesticks are formed using the open, high, low and close of the chosen time frame.
- The candlestick patterns reflect the psychology of the market and help the trader to buy or sell the market at the right time.
- There are 70+ observable candlestick patterns in the market.
What Is a Candlestick Chart?
A candlestick chart is a type of financial chart that shows the price movements of a security, derivative, or currency. Each candle represents a specific time frame (like 1 minute, 5 minutes, or a day) and tells the story of price action within that period.
You can also watch this video to learn more easily about the candlestick pattern:
What is the use of candlestick patterns in trading?
If you want to understand what is going on in the market then reading the candlestick pattern is very important.
By taking a look at the candlestick patterns you can understand the open, high, low and the close of the price. This helps in understanding how the price is moving in the market.
Using these patterns you will have the ability to understand what is going on in the market , by this you can have the power to know when to enter , when to exit and when to stay away from the market.
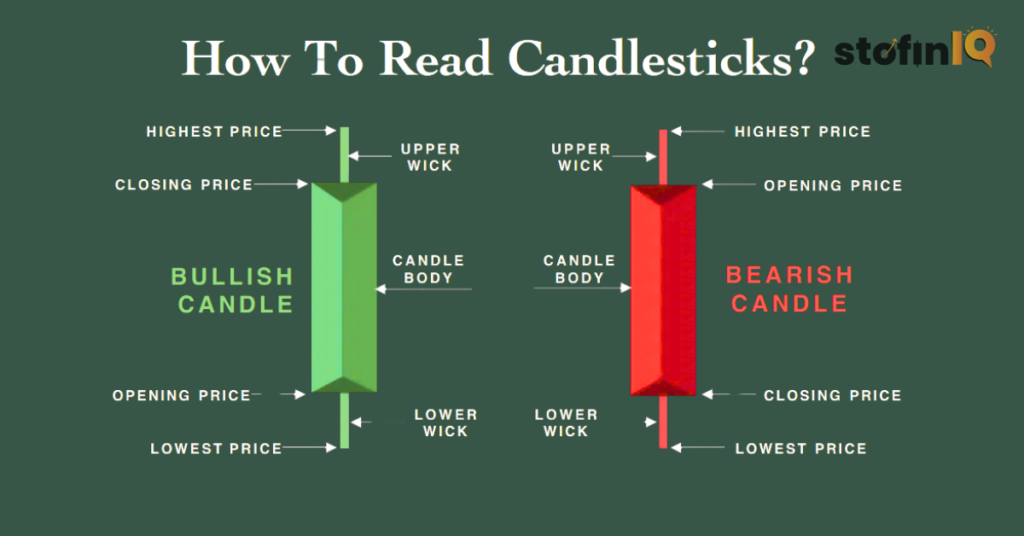
Since the candlestick is a representation of the Open, high, low and close of the market To understand the candle stick we must understand these terms.
Let’s consider a green candle:
- Opening Price: Lower point of the body
- Closing Price: Upper point of the body
- Lower Wick: Lowest price during the period
- Upper Wick: Highest price reached during the period
Conversely, a red candle forms when the closing price is below the opening price, indicating a bearish session.
Structure of a Candlestick
A candlestick consists of:
- The Body: Represents the difference between the opening and closing prices.
- Wick (or Shadow): Thin lines above and below the body indicate the high and low prices of the session.
- Colour:
- Green (or White): Price closed higher than it opened – bullish.
- Red (or Black): Price closed lower than it opened – bearish.
For example:
- A green candle means the share price increased during that time.
- A red candle means the price decreased.
Size of the candlestick patterns
The candlestick pattern can suggest the market psychology, if the body of the candlestick is long (that means it has a large difference between the opening and the closing price) it suggests that the buyers are stronger and they control the market.
If the body of the candlestick is shorter, (lower difference between the opening and the closing price)
Top Candlestick Patterns to Know
Let’s take a look at the most important candlestick patterns and how to use them in trading.
1. Hammer Candlestick Pattern
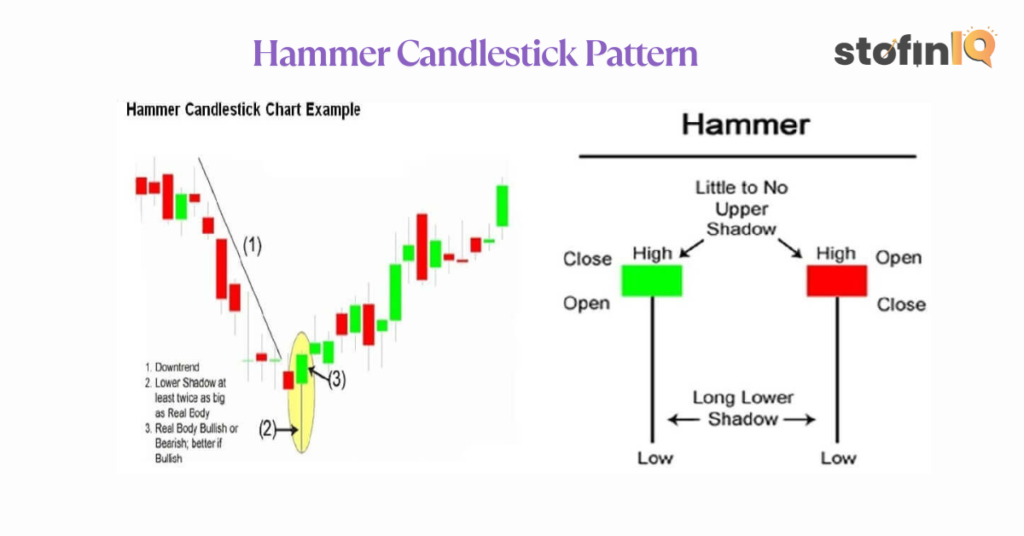
The hammer is a reversal candlestick pattern, this pattern occurs at the bottom of the downtrend. If we take a look at the picture we can observe that the seller here tries to push the market down, but the buyer dominated the market and that is why there was a reversal in the market.
Type: Bullish
Trend: Appears after a downtrend
Look: Small body, long lower wick, little or no upper wick.
Colour: Can be green or red
Meaning:
This pattern shows that sellers initially pushed the price down, but buyers regained control and closed the price near the opening level.
Trade Tip:
To trade this pattern:
- Confirm a prior downtrend
- Buy after the formation of the hammer candle.
- Stop-loss at the lowest point of the hammer
- Target: At least twice the stop-loss
Note: For a candle to qualify as a hammer, the lower wick should be at least twice the size of the body.
2. Hanging Man Candlestick Pattern

Hanging man contadary to the hammer is a bearish reversal pattern. This pattern appears at the end of the uptrend and have a small body. It has a very little or almost no upper shadow.
Type: Bearish
Trend: Appears at the top of an uptrend
Look: Same as a hammer but forms after an uptrend.
Colour: Can be red or green
Meaning:
It signals that despite buyers opening the price high, sellers managed to drag it down significantly, which may hint at a possible reversal.
Trade Tip:
- Consider short-selling under the hanging man candle
- Stop-loss above the high of the candle
- Best used in higher timeframes
3. Inverted Hammer Candlestick Pattern

The invented hammer candlestick pattern is a bullish reversal pattern, it usually appears at the downtrend. This candlestick has a small body and a long upper body or the wick.
Type: Bullish
Trend: After a downtrend
Look: Small body, long upper wick, little or no lower wick
Colour: Can be any, colour doesn’t matter
Meaning:
Bears tried to push prices lower, but bulls resisted and attempted a reversal.
Trade Tip:
- Buy above the high of the inverted hammer
- Stop-loss below its low
- Target: At least 2x your stop-loss or until trend changes
4. Shooting Star Candlestick Pattern
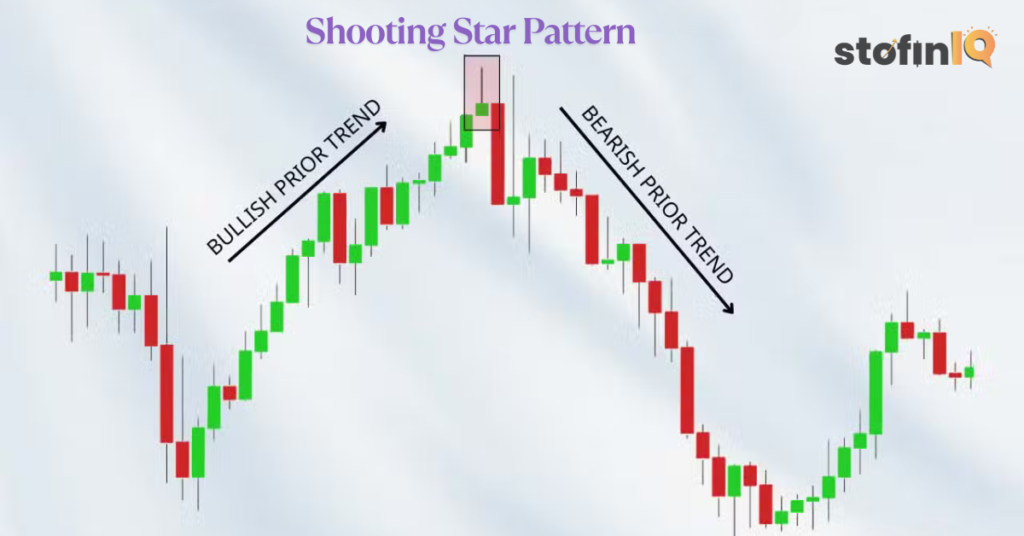
The shooting star candlestick pattern is formed when the open low and the close are similar. This candlestick has a small body and a long upper body.
Type: Bearish
Trend: Appears after an uptrend
Look: Small body, long upper wick, minimal or no lower wick
Meaning:
The shooting star candlestick indicates buyers tried to push prices higher, but sellers took over and brought prices down, signalling a potential reversal.
Trade Tip:
- Short-sell below the shooting star candle
- Stop-loss above its high
- Ideal for anticipating a bearish reversal
5. Bullish Marubozu Candlestick Pattern

A Bullish Marubozu candlestick is formed when the price opens at its low and closes at its high for a particular period, with no upper or lower shadows (wicks). A bullish Marubozu candlestick pattern has a long body with no upper or lower shadows.
Type: Strong Bullish
Trend: Trend not important
Look: Large green body with no or very small wicks
Meaning:
Shows complete control of buyers throughout the session—no price rejection from sellers.
Trade Tip:
- Buy after a bullish Marubozu candle
- Stop-loss slightly below the candle
- Target can vary based on resistance or trend analysis.
6. Bearish Marubozu Candlestick Pattern

A bearish Marubozu candlestick pattern is formed when the opening price equals the high for the period, and the closing price equals the low for the period, it has no wicks or shadows.
Type: Strong Bearish
Trend: Not important
Look: Large red body, no or negligible wicks
Meaning:
Sellers dominated the session, showing strong downward momentum.
Trade Tip:
- Short-sell after a bearish marubozu candle
- Place stop-loss just above the candle.
7. Spinning Top Candlestick Pattern
A spinning top candlestick pattern is formed when the market is constantly moving in one direction but then it is suddenly reversed in the opposite direction. The spinning top has a small short body and it has the upper and lower shadows of almost equal length.
Type: Neutral (Can be bullish or bearish based on context)
Trend:
- Bullish Spinning Top appears in a downtrend
- A bearish Spinning Top appears in an uptrend.
Look: Small body, long upper and lower wick.s
Meaning:
Indicates indecision in the market. Buyers and sellers both pushed the price, but neither could dominate.
Trade Tip:
- Use volume or trendline confirmation
- Entry above/below candle depending on prior trend
- Use a stop-loss beyond the high/low of the candle.
8. Doji Pattern Candlestick Pattern
The doji candlestick pattern tells us that the market has opened and closed at the same time. This pattern suggests that there is no clear decision between the buyers and the sellers. This shows that the market is not controlled by anyone at that moment.
Type: Indecision
Trend: Works in both uptrends and downtrends
Look: Very small or no body, have wicks on both sides
Meaning:
Opening and closing prices are almost the same, suggesting uncertainty.
Trade Tip:
- Wait for confirmation on the next candle
- Use similar entry/exit logic as the spinning top.
9. Dragonfly Doji Candlestick Pattern
The dragonfly doji is a bullish candlestick pattern. This pattern is formed when the open high and the close are the same price.
The dragonfly Doji, just like its name has a long tail this tail shows that the buyers are resistant and they are trying to push the market up.
Type: Bullish
Trend: Appears after a downtrend
Look: Long lower wick, no or very small upper wick, no body
Meaning:
Sellers pushed the price down, but buyers took control and brought it back up to the open.
Trade Tip:
- Use Stop-loss at the lowest point of the wick
- Hold until a reversal occurs.
10. Gravestone Doji Candlestick Pattern
The gravestone doji candlestick pattern is the opposite or the bullish version of the Dragonfly Doji candlestick. The gravestone Doji is known for its long upper tail. The gravestone Doji suggests that the market has a powerful supply or resistance area.
Type: Bearish
Trend: Appears at the top of an uptrend
Look: Long upper wick, no or very small body, little or no lower wick
Meaning:
Buyers tried to push the price higher, but sellers overwhelmed them, pulling the price back to the open.
Trade Tip:
- Consider short-selling below the gravestone doji
- Use the top of the wick as a stop-loss.
Tips to Trade with Candlestick Patterns
- Always Use Stop Loss
No pattern guarantees success. Risk management is key. - Check Volume
Confirm the strength of a pattern using trading volume. - Use Trend Confirmation
Most patterns are meaningful only when placed within a broader trend. - Use Tools like TradingView
Platforms like TradingView allow you to analyze charts and identify patterns easily. - Explore Candlestick Scanners
Websites like Chartink or ScreenerCanan help filter stocks showing specific candlestick patterns.
So, we have discussed the basics of candlestick patterns with you, these basics will help you with your trading journey.
Yes, there are many patterns to follow in trading but learning the basics will make you utilise the core of candlestick patterns and hence you will know how to read other patterns as well.
If you have read this far that means you have an appetite for understanding the market world. Since trading like any other skill requires a strong understanding of the concepts and strategies, we suggest you follow our blog website where we post blogs related to overall finance, the stock market, trading, crypto and mutual funds. Follow StofinIQ and enhance your financial journey.
References
I left my engineering job to follow my true passion writing and research. A passionate explorer of words and knowledge, I find joy in diving deep into topics and turning rich, insightful research into compelling, impactful content. Whether it’s storytelling, technical writing, or brand narratives, I believe that the right words can make a real difference.