How to Perform Trend Analysis for Profitable Trading
Trend analysis is a powerful technique traders use to identify and capitalize on market trends. By understanding and following these trends, you can make informed trading decisions and increase your chances of being profitable.
In This article we are discussing about How to Perform Trend Analysis for Profitable Trading. and we try to provides an overview of how to evaluate market trends, calculate trend percentages, and use technical tools to make informed trading decisions.
Table of Contents
Togglekey Points for you
- Understanding Trend Analysis
- Trend Percentage Formula
- Confirming a Bullish Trend
- Effective Charts and Indicators
- Analyzing Nifty Trends
How Do you Analyse a Trend in Trading?
Trend Analysis in Trading is the process of evaluating historical price movements and market data to determine the overall direction of a financial asset over a specific period. It involves identifying patterns and using technical and fundamental indicators to assess whether an asset is in an uptrend, downtrend, or moving sideways. The primary goal is to predict future price movements and make informed trading decisions.
Trend Percentage Formula

The Trend Percentage Formula is a straightforward method used to analyze changes over time by expressing current values as a percentage of a base value. The formula is calculated as:
Trend Percentage=(current values/Base value)x100
where the Current Value represents the data point being analyzed, and the Base Value is the reference or benchmark value. By multiplying the result by 100, the trend is expressed as a percentage, making it easy to compare relative changes across different periods.
For example, if a company’s revenue were $50,000 in the base year and grew to $75,000 in the current year, the trend percentage would be calculated as
75,000/50,000×100=150%
This result indicates a 50% increase in revenue compared to the base year, highlighting growth trends effectively. Trend percentage analysis is widely used in business, economics, and trading to assess performance or market movements over time.
How to Confirm a Bullish Trend?
A bullish trend is confirmed when an asset shows consistently higher highs and higher lows, trades above key moving averages (e.g., 50-day or 200-day), and exhibits strong momentum with indicators like RSI above 50 or a MACD crossover. Increasing volume during upward moves and breakouts above resistance levels or bullish patterns like ascending triangles further validate the trend.
What is a good p/e ratio?
A good P/E ratio (Price-to-Earnings ratio) depends on several factors, including the industry, the company’s growth prospects, and the overall market conditions. However, a general guideline is as follows:
- P/E ratio around 15-20: A P/E ratio within this range is often considered average or fair, indicating that a company is priced in line with its earnings potential.
- P/E ratio below 15: This could suggest that a company is undervalued relative to its earnings, or it may indicate that investors expect low growth or are cautious about the company’s future.
P/E ratio above 20: A high P/E may indicate that a company is overvalued or that investors expect significant growth in the future. High-growth companies (such as tech stocks) often have higher P/E ratios.
How to Draw a Trendline?
Drawing a trendline involves identifying the overall trend of an asset and connecting significant price points on its chart.
Step | Action |
1. Select the Asset | Choose the asset (stock, forex, crypto) and timeframe you wish to analyze. |
2. Identify the Trend | Determine if the trend is upward (bullish) or downward (bearish) based on price action. |
3. Identify Key Points | – For Uptrend: Look for higher lows. – For Downtrend: Look for lower highs. |
4. Draw the Trendline | – Uptrend: Connect at least 2 significant lows (higher lows). – Downtrend: Connect at least 2 significant highs (lower highs). |
5. Extend the Trendline | Extend the trendline beyond the selected points to project future price movements. |
6. Confirm the Trendline | Ensure the trendline touches multiple price points (ideally 3 or more) for better accuracy. |
How to Analyze Nifty Trends?
To analyze Nifty trends, start by examining the price chart to identify the overall direction—whether it is bullish, bearish, or consolidating.’
Examine the Price Chart: Identify the overall trend—bullish, bearish, or consolidating—by observing price movements.
Use Moving Averages: Check if Nifty is trading above key moving averages like the 50-day or 200-day, which typically indicate an uptrend.
Observe Highs and Lows: Look for patterns of higher highs and higher lows in an uptrend or lower highs and lower lows in a downtrend.
Apply Trendlines: Draw trendlines connecting significant lows (in an uptrend) or highs (in a downtrend) to confirm the direction.
Monitor RSI (Relative Strength Index): RSI above 50 suggests bullish momentum, while below 50 indicates bearish sentiment.
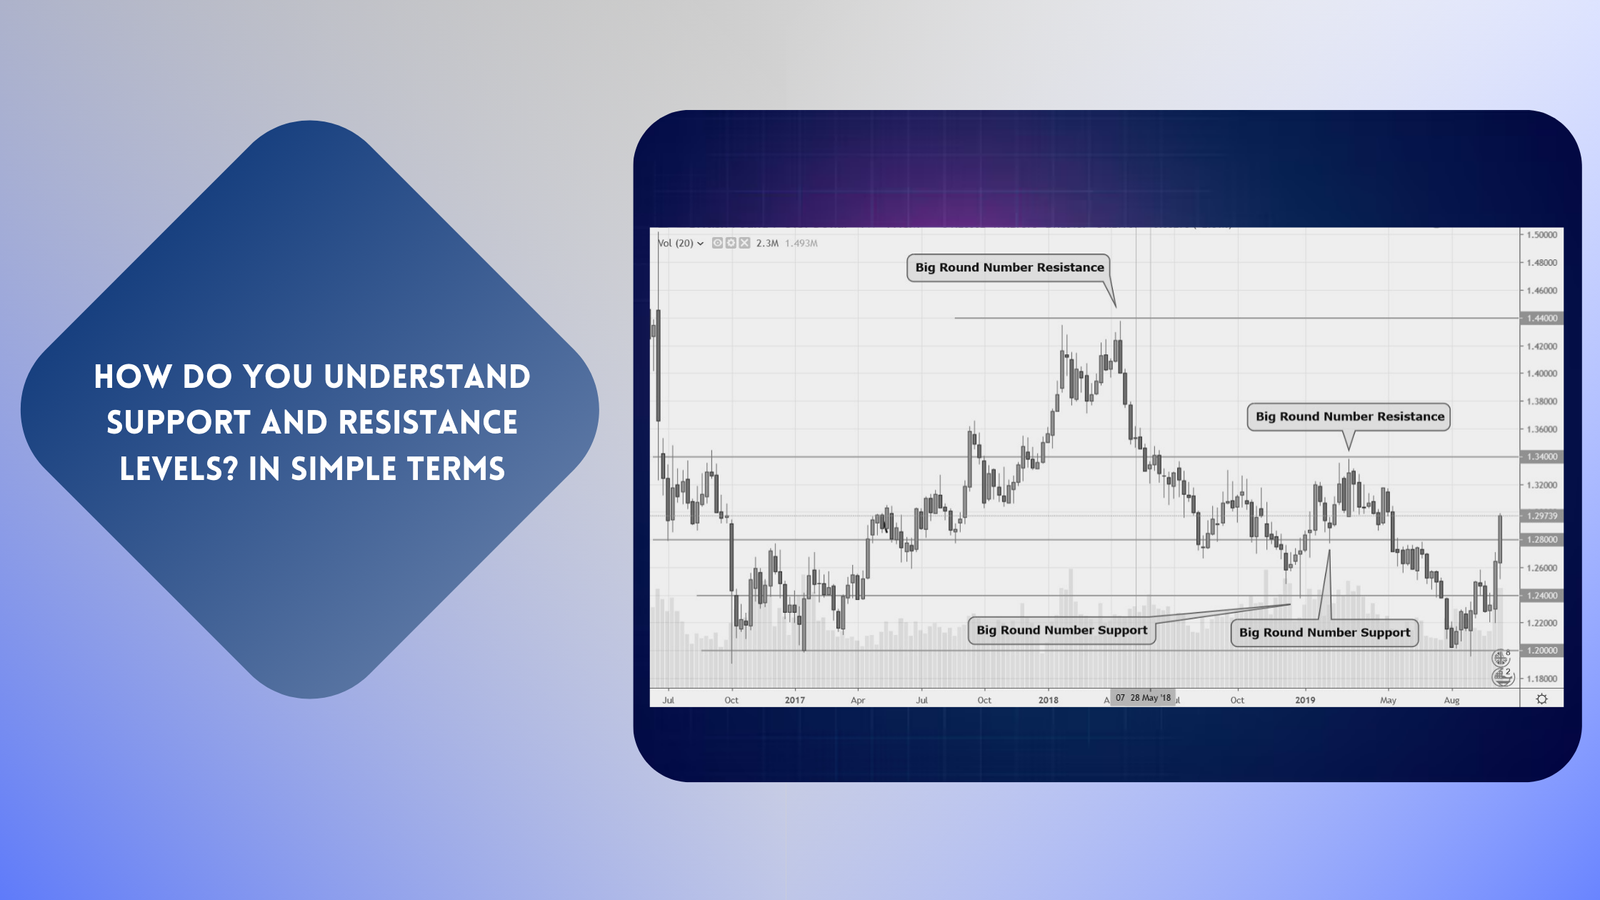
Identify Support and Resistance Levels: Key price levels help in predicting potential reversals or trend continuations.
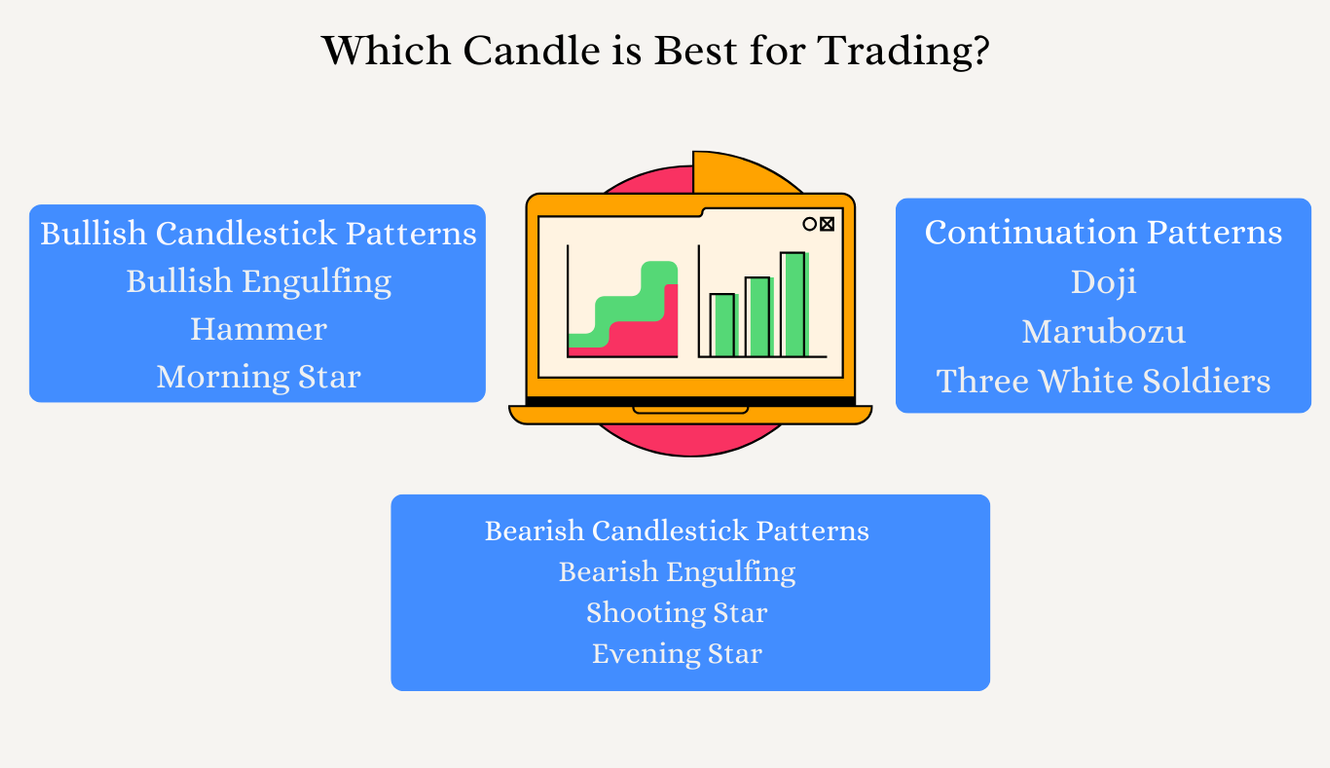
Which Candle is Best for Trading?
The best candlestick pattern for trading depends on your trading style (e.g., day trading, swing trading) and market conditions.
- Bullish Candlestick Patterns
Bullish Engulfing
Hammer
Morning Star
- Bearish Candlestick Patterns
Bearish Engulfing
Shooting Star
Evening Star
- Continuation Patterns
Doji
Marubozu
Three White Soldiers
For reversals, patterns like hammer, shooting star, or engulfing patterns are highly effective.
For continuations, patterns like Marubozu or Three White Soldiers can confirm strength in the trend.
Conclusion
Trend analysis is a critical component of successful trading, enabling traders to evaluate historical price movements, identify market directions, and make informed decisions. By using tools like trend percentage calculations, moving averages, RSI, and candlestick patterns, traders can effectively analyze and confirm market trends. Whether you’re analyzing Nifty trends or selecting the best candlestick patterns, a disciplined approach to trend analysis can significantly enhance profitability and trading confidence.
FAQs on How to Perform Trend Analysis for Profitable Trading
Q1 Which Indicator is best for Trend Direction?
Ans The Moving Average is one of the best indicators for identifying trend direction, as it smooths out price data to show the overall trajectory. A rising moving average indicates an uptrend, while a falling one signals a downtrend. Combining it with indicators like the MACD (Moving Average Convergence Divergence) or ADX (Average Directional Index) can provide stronger confirmation of the trend’s strength and direction.
Q2 Which chart is effective for trend analysis?
Ans The candlestick chart is the most effective for trend analysis due to its ability to display detailed price movements, including the open, high, low, and close for a specific period. Its visual clarity helps traders identify patterns, trends, and potential reversals quickly. Additionally, combining candlestick charts with technical indicators enhances the accuracy of trend predictions.
Q3 How to check PCR for nifty?
Ans To check PCR for Nifty, visit platforms like the NSE website or financial tools such as Moneycontrol. Look for the Nifty option chain data and calculate PCR using the formula:
PCR=Total Open Interest of PutsTotal Open Interest of Calls
PCR=
Total Open Interest of Calls
Total Open Interest of Puts
Q4 How to tell if PCR is successful?
Ans A PCR is successful if it accurately reflects market sentiment and aligns with price movements. A PCR above 1 indicates a bearish sentiment, and below 1 suggests a bullish sentiment. Combining it with other indicators confirms its effectiveness.
I'm Abhishek, a passionate and creative professional dedicated to making waves in the dynamic world of digital marketing. Today, I'm proud to bring my skills and experience to StofinIQ, where I thrive , delivering impactful content and innovative strategies to inspire and engage audiences.


Post Comment