What is the meaning of the Doji candlestick pattern?
The term “Doji” in Japanese means the same matter. It is used in candlestick patterns and trading to indicate uncertainty or decision-making between buyers and sellers or to indicate that nobody dominates the market and there is a tie between the sellers and the buyers.
What is the shape of the Doji Candlestick pattern?
The Doji candlestick pattern looks like a cross or a plus sign. The Doji candlestick pattern has a very small body, sometimes this body is even non-existent. The body of this candlestick indicates the opening and closing prices of the respective are almost equal, which means there is an indecision in the market.
Key Takeaways
- Doji means “same matter,” showing market indecision.
- It looks like a cross with a tiny or no body.
- It signals hesitation and a possible trend reversal.
- Appearing after a strong trend hints at weakening momentum.
- Shows traders’ uncertainty about price direction.
What is the significance of Doji?

A Doji is a symbol indicating market hesitation and a hint for a market reversal in either an upward or downward-trending market. Understanding and identifying patterns on trading charts for currencies, stocks, futures, or bonds is an important aspect of technical analysis for traders.Doji indicates the hesitation of the market to make sell or buy decisions, this also gives an additional hint about the reversal in the upward or downward-trending market.
Understanding the Doji is important because it has the following aspects:
Trend Reversal Clue: If a Doji appears after a strong uptrend or downtrend, it can be an early sign that the current trend may be weakening and a reversal might be coming.
Psychological Insight: It reflects hesitation among traders, how they’re unsure whether to continue pushing the price higher or lower. This hesitation often precedes a change.
Strategic Decision Point: For traders, a Doji is a signal to pay attention, not necessarily to act right away. So, It’s just like a yellow traffic light it tells you to slow down and watch what happens next.
Is Doji candlestick bearish or Bullish?
To understand this better, let’s get into the psychology of trading. Suppose the market has been rising steadily; buyers are in control and momentum is strong. Then, a Doji appears signalling hesitation as neither buyers nor sellers dominate. This sudden balance of forces suggests that the upward momentum might be weakening.
As a result, the pattern forms on the chart, showing a small or almost non-existent body with wicks on either side. Due to this, traders start questioning the strength of the trend. So, this uncertainty is reflected visually as a Doji on the chart. Hence, the pattern signals a potential reversal or pause. And if the next candles confirm a shift (for example, strong bearish candles after a Doji in an uptrend), it increases the probability of a bearish reversal.
What are the different types of Doji?
Doji candlesticks have been classified into multiple types and this classification is based on the position of the horizontal open-close line and the length of their wicks.
Here are the main types of the Doji candlesticks:
1. Gravestone Doji Candlestick Pattern:
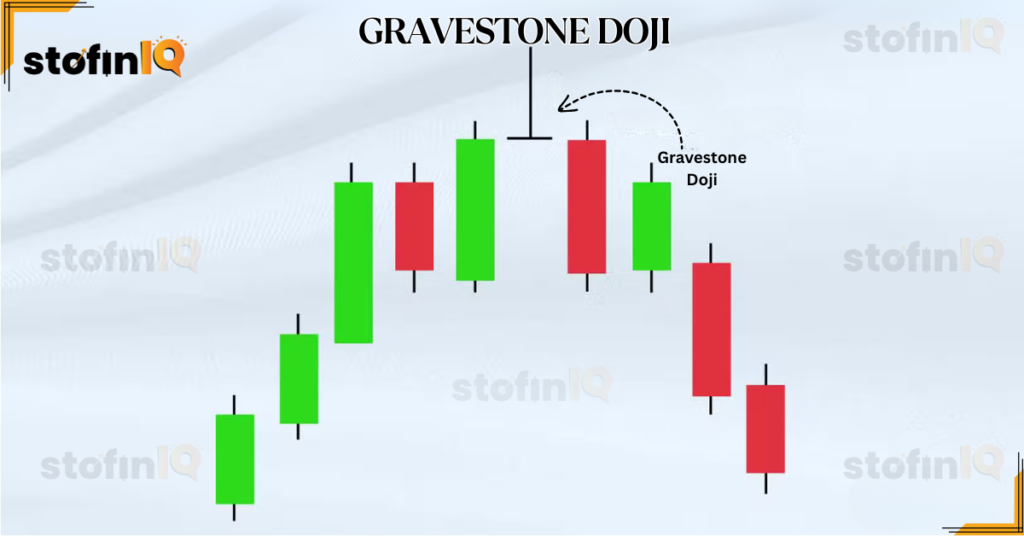
As you can see in the picture above, the buyers here managed to push the prices well above the open, but later the sellers tried to counteract and in that attempt, they pushed the market back down. This shows that the bulls here are losing the tug of war and the market is ready to be reversed.This pattern is called the Gravestone Doji Candlestick Pattern.
How to trade the Gravestone Doji Candlestick Pattern?
To trade the Gravestone Doji , one shall follow these steps:
Identify the pattern: Identifying the Gravestone Doji candlestick could be confusing, but this can be done by looking for a Gravestone Doji at the end of an uptrend. This pattern has a small body (open and close are near each other) and a long upper shadow (wick) that reaches much higher than the body.
Confirm the pattern: This can be done by checking a bearish reversal, the reversal could be spotted by checking a red candlestick that is following the gravestone candlestick.
Use other indicators: Since the candlestick is not standalone, thus one can use other indicators like the Supertrend indicator to confirm the signal.
Note: The weight of the bearish signal could be increased by the volume of the gravestone Doji, so check the volume too.
Plan the Trade: Once the gravestone doji is confirmed, think of entering a short position. Place a stop-loss order above the high of the Gravestone Doji to limit potential loss.
2. Dragonfly Doji Candlestick Pattern
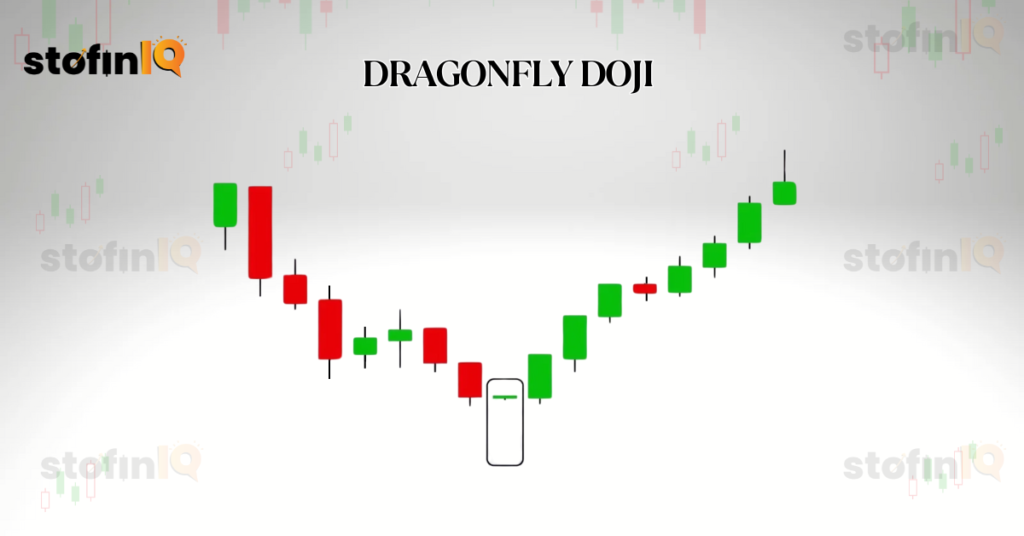
The image above shows the Dragonfly doji candlestick pattern. The dragonfly is like the bullish version of the Gravestone Doji mentioned above.
The psychology of the dragnfly candlestick can be understood by zooming in on the candlestick, here we can observe a long tail in this candlestick. This long tail suggests that there is a high Buying pressure in the area.
How to trade the Dragonfly Doji Candlestick Pattern?
To trade the Dragonfly Doji One shall follow these steps:
Identify the pattern: Look for the shape of the Doji candlestick, the Dragonfly Dojistick has a small or even a non-existent body. It has a long lower shadow, and its upper shadow is usually very short or non-existent too sometimes.
The dragonfly is highly dependent on the context you are viewing it from. If the Dragonfly is visible after a downtrend makes more sense as this will suggest a bullish reversal. Dragonfly Doji candle can strengthen the signal, this indicates strong buyer push-back against the initial sellers.
Confirm the pattern: Check the Bullish Divergence,Observe for bullish divergence on oscillators (e.g., RSI) to further strengthen the potential reversal signal.The bullish reversal can be confirmed by checking the bullish candle the next trading day that closes above the Dragonfly Doji’s high.
To further strengthen the reversal signal, divergence on oscillators can be observed using indicators ,start by entering a long (buy) position, when the confirmation candle closes above the Dragonfly’s Doji’s high.
Place a stop-loss order just below the low of the Dragonfly candle, this is done to limit the potential losses.
3. The Morning Star Candlestick Pattern
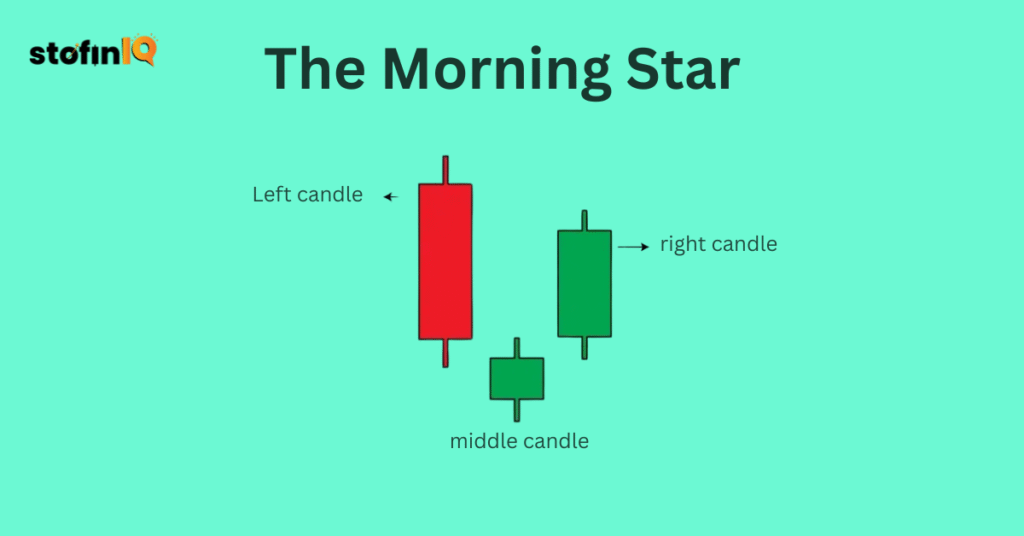
The morning star candlestick pattern is a bullish reversal pattern. The morning star doji candlestick occurs at the bottom of a downtrend, and it has three candlesticks:
As you can see on the left side of the image, there is a bearish candlestick which means the charge of the market has been taken by the sellers.
As you can see the small candlestick in the middle, This candlestick means that though the sellers were in control of the market still they could not push the market too lower. That is why this could be called bearish or bullish.
The candle at the last shows a bullish nature and here we can observe a trend reversal.
How to trade the Morning Star Doji candlestick
To trade the Morning Star Doji candlestick, follow the given steps:
Identify the pattern:The identification of the pattern can be done by checking the pattern as mentioned above.
Confirm the pattern: Try to check the increasing volume on the third bullish candle. Then look for the breakout at the high of the third candle, extra confirmation can be done by considering the pattern formation near the support level.
Enter the trade: Enter a long position at the opening of the third bullish candle or after a slight pullback.
Set Stop-Loss: Stop-loss can be placed below the low of the Doji candle or the low of the first bearish candle.
Set the profit target: The profit target can be checked based on the risk-reward ratio, the previous resistance level or the other technical analysis tools.
4. The evening star doji pattern
The evening star is a bearish Doji pattern. This pattern usually occurs at the top of an uptrend. This pattern, like the morning star doji candlestick, has three candlesticks:
- The first candlestick shows a bullish nature.
- The second candle looks like a bullish or a bearish candle. This can be a doji candlestick or even any other candlestick.
- The third candle shows a bearish nature.
So, the evening star doji pattern is basically a bearish version of the morning star doji candlestick pattern.
How to trade the evening Star Doji candlestick?
The trading of the evening star Doji candlestick pattern can be done by following these steps:
Identify the pattern: The doji star evening pattern can be identified as per the steps mentioned above.
Confirm the pattern: The pattern can be confirmed by, firstly checking if the market is already in an uptrend.
Note: Technical indicators like the Supertrend or the RSI should be used.
The increase in the third candle showcases that there is strong selling pressure in the market. Check if the third candle has broken a significant support level. This reinforces the bearish trend.
Enter the Evening star doji candlestick pattern: This can be done in a better way by entering the short position below the low of the third bearish candle thus confirming the bearish momentum.
How to use Doji in crypto trading?
A Doji also in the cryptocurrency trading could also be an indicator of a potential reversal or even a reversal of a trend. It is commonly applied by traders together with other indicators that are more accurate. The following way is how you can use it:
- Spot the Doji candle on a candlestick chart– this is a candle with a small body and protruding wicks.
- Look at the context, when it occurs, it may be a bearish reversal following a powerful uptrend or a bullish reversal following a down-trend.
- Check with volume or RSI-a Doji confirming with either high volume or oversold/overbought RSI is additional confirmation to this reversal signal.
- Be patient and wait-wait till the next candle confirms the turnaround in trend before taking a trade.
- Put in the stop-losses– never use stop-loss on the Doji itself.
What is a long-legged doji candle?
A long-legged doji is one of the trading candlestick patterns, and it indicates impressive lack of conviction in the market. The body is almost invisible or very small in terms of length and the upper and lower shadows (wicks) are very long which implies that prices fluctuated a lot both down and up but ended essentially at the same level. The pattern can be found at an end of a trend or the beginning of a trend and can indicate a possible reversal or a stalling of the movement of the market.
What is the difference between a Doji and a Spinning Top?
Doji shows that it looks like a candlestick pattern and is formed when the opening and closing prices are so close that the real body is very small or absent. It is a sign of stiff market uncertainty with no party gaining control, either buyer or seller. The upper and lower shadows of the Dojis, particularly those of a long-legged doji, tend to be long,g and Dojis are most usually regarded as an indication of a possible reversal of the trend, and this tendency is the greater when the doji is seen following an impressive bullish or bearish momentum.
Spinning Top, on the other hand, is also an indicator of indecision but has a small actual body with upper and lower shadows whose lengths are fluidly near equal. As opposed to a Doji, open and close prices in a Spinning Top are not equal (albeit near) to each other. This trend indicates a kind of tug-of-war between the bulls and the bears, though it has more movement compared to Doji. Although both patterns are signs of uncertainty, Doji represents a greater degree of market balance as compared to the Spinning Top, which suggests a mild dosage of indecision with a slight directional bias.
How to Use Doji to Predict a Price Reversal?
Doji aspirations could signify a struggling market, and this is usually an indicator that could forebode a price reversal when it forms after a very positive price trend or a very negative price trend. A good way to interpret a Doji is by noting the situation that the Doji arises in; a Doji following a bullish rally would suggest a loss of purchasing strength and a potential reversal to bear.
On the other hand, in the case it appears following a steep drop, this would indicate that momentum is being lost by sellers, and a bullish reversal may then occur. Traders tend to have confirmation by waiting to have a break in the opposite direction of the existing trend by using of 2nd successive candlestick as a way of reinforcing the Trading pin Doji.
FAQ related to the Doji candlestick pattern
A Doji pattern is formed when the opening and closing price of a security are almost equal, leaving a short or no body on the chart. This is a sign of market indecision since neither bulls nor bears have succeeded in substantially pushing the price up or down. It usually forms when buyers and sellers are balanced and hence no clear direction.
Both doji and spinning top candlestick formations are indicative of indecision on the market but with the variation in the body size of the real body. A Doji features a minute or nearly insignificant body, denoting that opening and closing prices are nearly identical. A Spinning Top has a small real body but is visible, exhibiting some movement from opening to closing prices.
Provides early trend reversal signals:
If the Doji candlestick pattern appears after a significant trend or near support/resistance, it indicates a potential shift in direction.
Can be used as a market Market indecision indicator:
This is crucial because it helps traders understand whether a trend is losing steam or if the market is hesitant before a significant move.
Improved Trade Timing:
By understanding the turning points the traders have a better time with their entries and exits, this increases the chances of profits.
Versatility in time frames:
Doji patterns can be observed and utilized effectively across various timeframes, from intraday charts to weekly charts, making them a valuable tool for traders of different styles.
False signals:
Sometimes the Doji candlestick pattern can appear without leading to a false signal and due to this the trader can be misguided and face potential losses.
Need for confirmation:
Traders can not rely on the Doji candlestick alone; other tools are needed for confirmation, thus the patterns are not stand-alone.
Less reliable in a sideways market:
If there is no specific trend in the market, Doji candlesticks become less reliable.
The Doji candlestick pattern can be identified by the following:
The shape:
The doji candlestick has a specific shape, which is the shape of the cross.
Check the open and closing prices:
The open and closing prices of the doji candlestick pattern are the same.
The wicks:
The length of the upper and the lower wicks tells the highest and lowest prices during the period.
Doji candlestick patterns are the most effective in market conditions where there are the possibilities of possible clear trends.
Doji candlesticks also depend highly on the volatility of the market, if the market is too volatile, then it might start giving false signals, so a less volatile market is ideal for Doji candlesticks.
Doji candlestick charts are very beneficial to cut the noise in the market .Thus, we can’t trust them without taking help from other tools.
The true significance of them can only be understood from the context of the market.
To learn more about trading and the stock market, do not forget to follow our website, StonfinIQ
Reference:
I left my engineering job to follow my true passion writing and research. A passionate explorer of words and knowledge, I find joy in diving deep into topics and turning rich, insightful research into compelling, impactful content. Whether it’s storytelling, technical writing, or brand narratives, I believe that the right words can make a real difference.