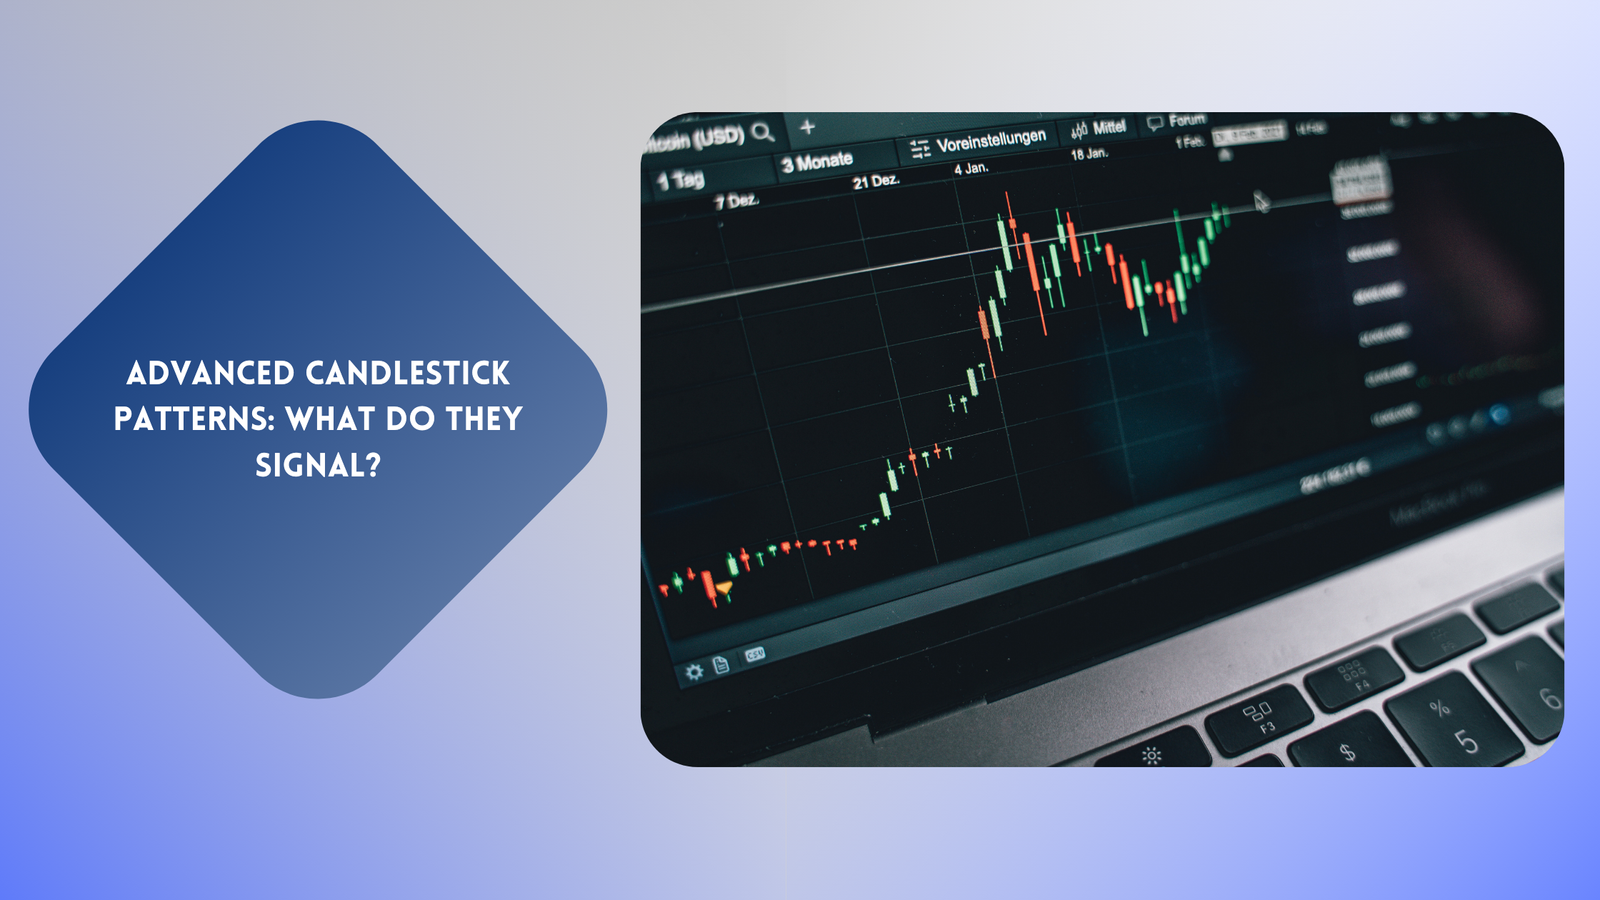
Advanced Candlestick Patterns: What Do They Signal?
The Advanced Candlestick Patterns are sophisticated charting formations used in technical analysis to interpret and predict market behavior. Unlike basic candlestick patterns that involve single or simple combinations of candlesticks (e.g., Hammer or Doji), advanced patterns are more complex and often involve multiple candlesticks over several trading periods. These patterns provide insights into market sentiment, potential trend reversals, or continuations.
In The article we are talking about the advanced candlestick patterns and what do they signal? we try to explores sophisticated candlestick patterns used in technical analysis for interpreting market behavior.
Table of Contents
ToggleWhat is the Significance of Candlestick Patterns?
Candlestick patterns are crucial in technical analysis as they visually represent market sentiment and the battle between buyers and sellers. They help identify potential trend reversals, continuations, and key entry or exit points in trades. These patterns work across various markets and timeframes, offering insights into price movements. When combined with other indicators, they enhance trading accuracy and decision-making.
Key Advanced Candlestick Patterns
Engulfing Patterns
Bullish Engulfing: A larger bullish candle engulfs a smaller bearish candle, signaling a reversal to an uptrend.
Bearish Engulfing: A larger bearish candle engulfs a smaller bullish candle, indicating a reversal to a downtrend.
Morning Star and Evening Star
Morning Star (Bullish): A three-candle pattern that starts with a bearish candle, followed by a small indecisive candle (Doji or small body), and ends with a large bullish candle, signaling reversal from a downtrend.
Evening Star (Bearish): The opposite of the Morning Star, signaling reversal from an uptrend.
Three White Soldiers and Three Black Crows
Three White Soldiers: Three consecutive bullish candles with higher closes, signaling a strong uptrend.
Three Black Crows: Three consecutive bearish candles with lower closes, indicating a strong downtrend.
Rising and Falling Three Methods
Rising Three Methods: A bullish continuation pattern where three small bearish candles form within the range of a larger bullish candle, followed by another bullish candle breaking higher.
Falling Three Methods: The bearish counterpart, signaling the continuation of a downtrend.
Harami Patterns
Bullish Harami: A small bullish candle forms within the range of a larger bearish candle, indicating a potential reversal upward.
Bearish Harami: A small bearish candle forms within a larger bullish candle, signaling a potential downward reversal.
Abandoned Baby
A rare three-candle reversal pattern with a Doji that “gaps” away from the previous and following candles, indicating a sharp trend reversal.
Tweezer Tops and Bottoms
Tweezer Top: Two or more candles with similar high points, signaling resistance, and a potential downward reversal.
Tweezer Bottom: Two or more candles with similar low points, indicating support and a potential upward reversal.
Who is the Father of Modern Candlestick?
The father of modern candlestick charting is Munehisa Homma, a Japanese rice trader from the 18th century. He is credited with pioneering the candlestick trading techniques that form the foundation of modern technical analysis.
What is the most Powerful Candlestick Pattern?
Advanced candlestick patterns are powerful tools in technical analysis that signal key market behaviors such as trend reversals, continuation patterns, or shifts in market momentum. By analyzing the interaction of multiple candlesticks, these patterns help traders predict potential price movements more accurately.
What is the Rarest Candlestick Pattern?
The rarest candlestick pattern is widely considered to be the Abandoned Baby pattern. This pattern is infrequent because it requires a very specific alignment of price gaps and candlestick formations that occur under unique market conditions.
It is also rare because
The pattern relies on precise price movements and strong reversals, which occur under specific market conditions.
Often forms during volatile events like news releases or low trading volumes.
Bullish Abandoned Baby:
Appears at the end of a downtrend.
Indicates a shift to bullish momentum.
Bearish Abandoned Baby:
Appears at the end of an uptrend.
Suggests a move toward bearish sentiment.
How to Identify a Fair Value Gap?
A Fair Value Gap (FVG) can be identified by observing areas where there is a significant price imbalance, often created by strong momentum in one direction. To spot a fair value gap, look for large candlesticks with long bodies and minimal wicks, which indicate aggressive buying or selling. These large candles often leave a gap between their high and the low of the subsequent candle, or between consecutive candles, creating an imbalance in price action.
How to Identify a Fair Value Gap (FVG) in 5 Points
Look for Large Momentum Candles |
Observe Gaps Between Candles |
Check for Price Imbalance |
Confirm the Trend |
Watch for Retracement |
Which Candlestick Indicates Buy?
These patterns suggest that buyers are gaining strength, and prices may rise. Below are some key candlestick patterns that indicate a buying opportunity:
- Hammer
- Bullish Engulfing
- Morning Star
- Piercing Pattern
- Three White Soldiers
- Doji at Support
Conclusion
Candlestick patterns, whether basic or advanced, are powerful tools in technical analysis, offering traders a visual representation of market sentiment and price action. Advanced patterns, like the Morning Star, Engulfing Patterns, and Abandoned Baby, provide deeper insights into potential trend reversals and continuations, helping traders make informed decisions. The ability to identify patterns such as Fair Value Gaps or buying signals further empowers traders to capitalize on opportunities while managing risks effectively. Mastering candlestick patterns is a key step toward achieving consistency and success in trading.
FAQs on Advanced Candlestick Patterns and What Do They Signal?
Q1 What is the psychology of candlestick patterns?
Ans The psychology of candlestick patterns reveals the emotions and behaviors of market participants, such as fear, greed, and indecision, during a specific period. Each pattern reflects the battle between buyers and sellers, showing shifts in market sentiment. By understanding these dynamics, traders can anticipate price movements and make informed decisions.
Q2 How is Heikin Ashi calculated?
Ans Heikin Ashi is calculated by averaging the open, high, low, and close prices to smooth out price action and reduce market noise. The open is the average of the previous candle’s open and close, while the close is the average of the current period’s open, high, low, and close. The high and low values are based on the maximum and minimum of the current candle’s price and the Heikin Ashi open and close.
Q3 Is it a bearish buy or sell?
Ans A bearish signal typically indicates a sell opportunity. It suggests that the price is likely to decrease, and traders may consider selling or exiting long positions in anticipation of a downtrend. Bearish patterns or signals reflect market sentiment where sellers are in control.
Q4 Do professional traders use candlestick charts?
Ans Yes, professional traders widely use candlestick charts in their technical analysis. These charts provide a visual representation of price movements over time, helping traders identify trends, reversals, and market sentiment. Candlestick patterns, such as bullish or bearish signals, are essential tools for professionals to make informed decisions regarding entry and exit points in various markets. By combining candlestick analysis with other technical indicators, traders can enhance their strategies and improve trading accuracy.
Q5 What is the three candlestick rule?
Ans The Three Candlestick Rule refers to specific candlestick patterns that involve three consecutive candles and are used to identify potential reversals or trend continuations in the market.
Three White Soldiers (Bullish Reversal)
Three Black Crows (Bearish Reversal)
Three Inside Up/Down (Continuation)
I'm Abhishek, a passionate and creative professional dedicated to making waves in the dynamic world of digital marketing. Today, I'm proud to bring my skills and experience to StofinIQ, where I thrive , delivering impactful content and innovative strategies to inspire and engage audiences.


Post Comment